Overview
SuperTrend is one of the most popular trend-following indicators among traders seeking clear, unambiguous signals. Unlike oscillators that fluctuate within ranges, SuperTrend provides definitive directional guidance: the indicator line appears either above price (bearish) or below price (bullish), with color changes marking trend reversals.
The indicator was developed by Olivier Seban and combines volatility measurement (through ATR - Average True Range) with trend identification. By basing its bands on ATR, SuperTrend automatically adapts to changing market volatility. In high-volatility periods, the bands widen to avoid premature stops. In low-volatility periods, the bands tighten to capture smaller moves.
SuperTrend excels as both a signal generator and a trade management tool. As a signal generator, it provides clear entry points when the indicator changes color. As a trade management tool, it functions as a dynamic trailing stop that adjusts with volatility. Many systematic traders use SuperTrend as the foundation for rule-based strategies due to its objective, non-subjective nature.
Key Benefits
- Clear, unambiguous trend direction with color-coded visualization
- Built-in volatility adaptation through ATR-based calculation
- Functions as both entry signal and trailing stop
- Simple to understand and implement in systematic strategies
How SuperTrend is Calculated
SuperTrend calculates two bands using Average True Range (ATR) and then determines which band to display based on price action. The calculation involves several steps:
Step 1: Calculate ATR
First, calculate the Average True Range over the specified period (typically 10 periods). ATR measures volatility by considering the full range of price movement, including gaps.
Step 2: Calculate Basic Bands
Using the median price (High + Low) / 2, calculate the basic upper and lower bands:
Basic Upper Band = (High + Low) / 2 + (Multiplier x ATR)
Basic Lower Band = (High + Low) / 2 - (Multiplier x ATR)
Step 3: Calculate Final Bands
The final bands are calculated with logic that prevents the bands from moving against the trend:
- Final Upper Band: The lesser of current Basic Upper Band and previous Final Upper Band (if previous close was above previous Final Upper Band)
- Final Lower Band: The greater of current Basic Lower Band and previous Final Lower Band (if previous close was below previous Final Lower Band)
Step 4: Determine SuperTrend
The SuperTrend value and color are determined by price position relative to the bands:
- If price closes above the Final Upper Band, SuperTrend = Final Lower Band (bullish, shown green)
- If price closes below the Final Lower Band, SuperTrend = Final Upper Band (bearish, shown red)
- Otherwise, SuperTrend maintains its previous value and color
Trading Signals
Buy Signal
A buy signal occurs when SuperTrend changes from red to green (bearish to bullish). This happens when price closes above the upper SuperTrend band after being in a downtrend. The signal marks the start of a new uptrend according to the indicator. Enter long at the close of the signal bar or the open of the next bar.
Sell Signal
A sell signal occurs when SuperTrend changes from green to red (bullish to bearish). This happens when price closes below the lower SuperTrend band after being in an uptrend. The signal marks the start of a new downtrend. Enter short at the close of the signal bar or the open of the next bar.
Trailing Stop
Use the SuperTrend line as a dynamic trailing stop. In a long position, place your stop just below the green SuperTrend line. As the trend continues and price rises, SuperTrend rises with it, automatically trailing your stop higher. Your exit occurs when price closes below SuperTrend, changing it to red. The same logic applies in reverse for short positions.
Signal Quality Filters
- Higher Timeframe: Only take signals in the direction of the higher timeframe SuperTrend.
- Strong Closes: Look for signal bars that close near their high (buy) or low (sell) for stronger momentum.
- Volume Confirmation: Higher volume on signal bars indicates stronger conviction.
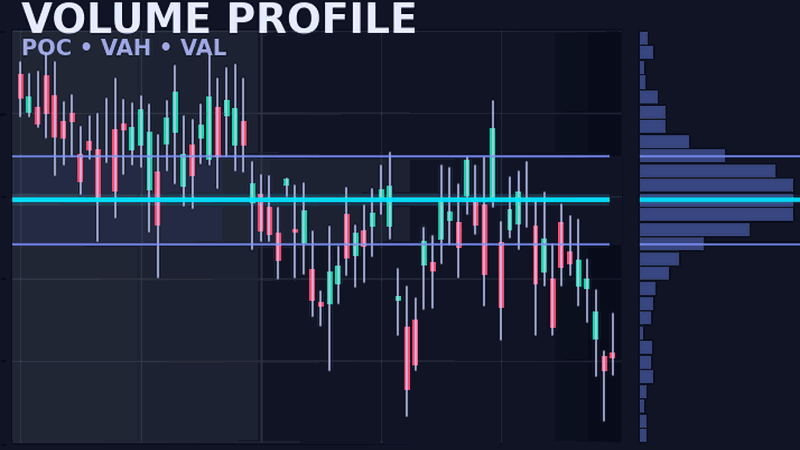
- Level Confluence: Signals at key Volume Profile or VWAP levels have higher probability.
Professional SuperTrend Suite
Multi-timeframe SuperTrend, alert notifications, customizable visualization, and strategy backtesting.
Trading Strategies
Basic Trend Following
The simplest strategy is to follow SuperTrend signals directly. Enter long when SuperTrend turns green, exit when it turns red. Enter short when it turns red, exit when it turns green. This creates a "always in" approach where you are always positioned in the market. This works well in strongly trending markets but can be costly in choppy conditions.
Multi-Timeframe Strategy
Use a higher timeframe SuperTrend as a trend filter. For example, if trading on a 15-minute chart, check the 1-hour SuperTrend for overall direction. Only take 15-minute buy signals when the hourly SuperTrend is green. Only take 15-minute sell signals when the hourly SuperTrend is red. This reduces whipsaws by aligning with the larger trend.
Pullback Entry
Instead of entering immediately on a SuperTrend flip, wait for price to pull back toward the SuperTrend line. In a bullish SuperTrend (green), wait for price to retrace toward the SuperTrend line before entering long. This provides better risk-reward as your stop (just below SuperTrend) is tighter. Enter when price bounces off the SuperTrend line with a bullish candle.
SuperTrend with RSI
Combine SuperTrend with RSI for additional confirmation. Take SuperTrend buy signals only when RSI is above 50 (or rising from oversold). Take sell signals only when RSI is below 50 (or falling from overbought). This adds a momentum filter to the trend signals.
Double SuperTrend
Use two SuperTrend indicators with different settings (e.g., 10/3 and 21/2). Enter when both indicators are aligned in the same direction. This filters out some weaker signals while capturing stronger trend moves. Exit when the faster SuperTrend flips or use other exit criteria.
NinjaScript Implementation
The following code demonstrates the core SuperTrend calculation logic in NinjaScript. This implementation shows how to calculate ATR-based bands and determine trend direction.
namespace NinjaTrader.NinjaScript.Indicators
{
    public class SuperTrend : Indicator
    {
        private ATR atr;
        private double finalUpperBand;
        private double finalLowerBand;
        private int trend; // 1 = bullish, -1 = bearish

        [NinjaScriptProperty]
        public int Period { get; set; }

        [NinjaScriptProperty]
        public double Multiplier { get; set; }

        protected override void OnStateChange()
        {
            if (State == State.SetDefaults)
            {
                Description = "SuperTrend Indicator";
                Name = "SuperTrend";
                Period = 10;
                Multiplier = 3.0;
                IsOverlay = true;
                AddPlot(Brushes.Green, "SuperTrend");
            }
            else if (State == State.DataLoaded)
            {
                atr = ATR(Period);
            }
        }

        protected override void OnBarUpdate()
        {
            if (CurrentBar < Period) return;

            double medianPrice = (High[0] + Low[0]) / 2;
            double basicUpperBand = medianPrice + (Multiplier * atr[0]);
            double basicLowerBand = medianPrice - (Multiplier * atr[0]);

            // Calculate final upper band
            if (basicUpperBand < finalUpperBand || Close[1] > finalUpperBand)
                finalUpperBand = basicUpperBand;

            // Calculate final lower band
            if (basicLowerBand > finalLowerBand || Close[1] < finalLowerBand)
                finalLowerBand = basicLowerBand;

            // Determine trend
            if (Close[0] > finalUpperBand)
                trend = 1;
            else if (Close[0] < finalLowerBand)
                trend = -1;

            // Set SuperTrend value and color
            if (trend == 1)
            {
                Values[0][0] = finalLowerBand;
                PlotBrushes[0][0] = Brushes.Green;
            }
            else
            {
                Values[0][0] = finalUpperBand;
                PlotBrushes[0][0] = Brushes.Red;
            }
        }
    }
}
To add alerts for trend changes, check when the trend variable changes from the previous bar and trigger a notification. For multi-timeframe analysis, add a secondary data series with a larger timeframe.
Settings and Configuration
SuperTrend has only two parameters, making it simple to optimize for different markets and trading styles.
Period (Default: 10)
The Period setting determines how many bars are used to calculate the ATR. Shorter periods (7-10) make ATR more responsive to recent volatility changes but can produce more whipsaws. Longer periods (14-21) smooth out ATR and produce fewer signals but may lag in fast-moving markets.
Multiplier (Default: 3.0)
The Multiplier determines how far from the median price the bands are placed. A multiplier of 3 means the bands are 3x ATR away from the median. Lower multipliers (2.0-2.5) produce tighter bands with more signals but more whipsaws. Higher multipliers (3.5-4.0) produce wider bands with fewer signals but less noise.
Common Settings by Trading Style
- Scalping (fast): Period 7, Multiplier 2.0 - More signals, tighter stops
- Day Trading (standard): Period 10, Multiplier 3.0 - Balanced approach
- Swing Trading (slow): Period 14, Multiplier 3.5 - Fewer signals, wider stops
- Position Trading: Period 21, Multiplier 4.0 - Only major trend changes
Optimization Tips
The optimal settings depend on the instrument's volatility characteristics. More volatile instruments may need higher multipliers to avoid whipsaws. Test settings on historical data but be cautious of over-optimization. Settings that perform best in backtests may not perform as well in live trading due to changing market conditions.
Frequently Asked Questions
What is the SuperTrend indicator?
SuperTrend is an ATR-based trend-following indicator that plots above or below price to show trend direction. When price closes above SuperTrend (green), the trend is bullish. When price closes below (red), the trend is bearish. It provides clear buy/sell signals on trend changes.
How is SuperTrend calculated?
SuperTrend uses Average True Range (ATR) multiplied by a factor (typically 3) added to or subtracted from a median price. The upper band is median - (ATR x multiplier), lower band is median + (ATR x multiplier). The indicator flips between bands based on price closes.
What are the best SuperTrend settings?
The default settings are period 10 and multiplier 3. For more signals, use a smaller multiplier (2) or shorter period (7). For fewer, smoother signals, use a larger multiplier (4) or longer period (14). Adjust based on the instrument's volatility.
Can SuperTrend be used for stop losses?
Yes, SuperTrend is commonly used as a trailing stop. In a long position, place your stop just below the green SuperTrend line. As price rises, SuperTrend rises with it, trailing your stop. When price closes below SuperTrend, the trade exits.
Does SuperTrend work in ranging markets?
SuperTrend performs best in trending markets. In choppy, ranging conditions, it can produce whipsaws as price crosses the indicator repeatedly. Filter signals with higher timeframe trend analysis or add additional confirmation indicators.
How do I trade SuperTrend signals?
Enter long when SuperTrend flips from red to green (price closes above). Enter short when it flips from green to red (price closes below). Use SuperTrend as your initial stop and trail it as the trend develops. Exit when SuperTrend changes color.