Overview
Order flow analysis is the study of actual transactions occurring in the market, examining the battle between aggressive buyers and sellers at every price level. Unlike traditional candlestick or bar charts that only show open, high, low, close, and volume, order flow reveals the internal dynamics of each bar - how much volume was traded at the bid versus the ask, where aggressive buying or selling occurred, and how the balance of power shifted throughout the bar's formation.
The foundation of order flow analysis rests on a simple principle: when a trader wants to buy immediately, they must lift the offer (trade at the ask price); when they want to sell immediately, they must hit the bid (trade at the bid price). By tracking these aggressive trades, we can identify whether buyers or sellers are in control at any given moment. This information is invisible on standard charts but can provide significant edge when making trading decisions.
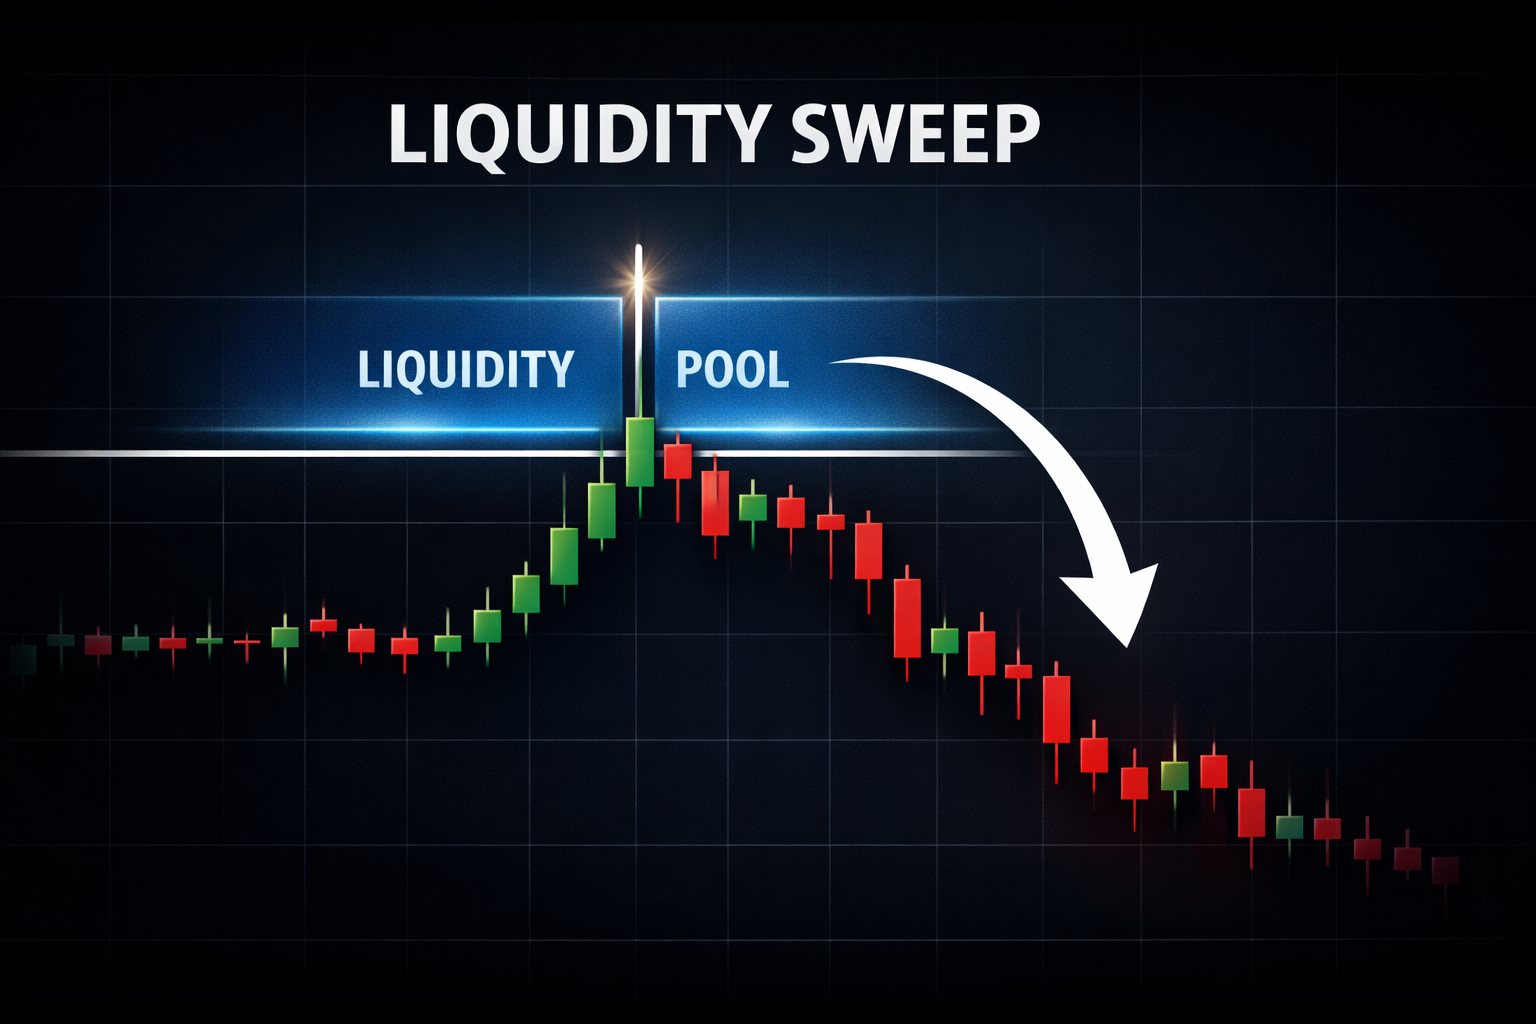
Order flow complements Liquidity Sweep analysis by showing absorption at sweep levels, helping confirm whether a sweep is likely to reverse or continue. For day traders and scalpers trading futures on NinjaTrader 8, order flow provides the granular insight needed to time entries precisely, identify when moves are likely to fail, and spot institutional activity through absorption and imbalance patterns.
Key Benefits
- See buying vs selling pressure inside each bar, not just the result
- Identify absorption where large limit orders stop aggressive traders
- Spot divergence between price and delta before reversals
- Confirm breakouts with volume imbalance analysis
Key Concepts
Delta
Delta is the fundamental metric of order flow analysis, representing the difference between volume traded at the ask (aggressive buyers) and volume traded at the bid (aggressive sellers). When a market order buys, it executes at the ask price, adding to ask volume. When a market order sells, it executes at the bid price, adding to bid volume. The formula is straightforward:
Delta = Ask Volume - Bid Volume
Positive delta indicates that aggressive buyers dominated the period - more volume was lifted at the ask than hit at the bid. Negative delta indicates aggressive sellers dominated. A bar with +500 delta means 500 more contracts were bought at the ask than sold at the bid during that bar's formation. The magnitude matters: +50 delta is a minor imbalance; +500 delta in the same instrument is significant aggression.
Cumulative Delta
Cumulative delta is a running total of delta over time, showing the overall balance of buying versus selling pressure across multiple bars. It answers the question: "Since the session (or period) began, who has been more aggressive overall - buyers or sellers?" Rising cumulative delta indicates sustained buying pressure; falling cumulative delta indicates sustained selling pressure.
The most powerful use of cumulative delta is divergence analysis. When price makes a new high but cumulative delta fails to make a new high, it suggests that buyers are losing enthusiasm despite the higher prices - a bearish divergence warning of potential reversal. Conversely, when price makes a new low but cumulative delta doesn't make a new low, buyers are becoming aggressive at lower prices - a bullish divergence signal.
Footprint Charts
Footprint charts provide the most detailed view of order flow by displaying bid and ask volume at each price level within a single bar. Instead of seeing just one volume number for the entire bar, you see how volume was distributed across every tick - revealing where buyers and sellers were most aggressive, where absorption occurred, and where imbalances formed.
Common footprint display formats include: Bid x Ask showing raw bid and ask volume side by side at each price; Delta showing the difference at each level (ask - bid); and Volume showing total volume at each price. Each format highlights different aspects of the bar's internal structure. Professional traders often use multiple formats or toggle between them based on what they're analyzing.
Volume Imbalance
Volume imbalance occurs when one side significantly outweighs the other at a specific price level. Typically, an imbalance is defined as when ask volume is 200-400% greater than bid volume (or vice versa) at a single price level. These imbalances represent strong directional aggression and often indicate institutional activity.
Stacked imbalances - multiple consecutive price levels all showing imbalance in the same direction - create powerful signals. A series of buying imbalances stacked vertically indicates aggressive, sustained buying that swept through multiple price levels. Diagonal imbalances across bars show continuation of directional pressure. Traders look for stacked imbalances to confirm breakout moves and directional commitment.
Absorption
Absorption occurs when large limit orders absorb aggressive market orders without allowing price to move significantly. Picture a scenario: aggressive sellers hit the bid repeatedly at a support level, but price doesn't drop because a large buyer is sitting there with massive limit orders, absorbing all the selling. The footprint shows high volume at that price but no follow-through in price - a classic absorption signature.
Absorption often precedes reversals because it represents a large player actively defending a price level. When you see significant delta (lots of aggressive selling) at a price that doesn't break down, someone is absorbing that flow. Once the aggressive sellers exhaust themselves, price often reverses sharply in the direction of the absorbing party. Look for high volume, stacked footprint at a level, combined with minimal price movement beyond that level.
Professional Order Flow Suite
Real-time delta analysis, footprint visualization, volume imbalance detection, and cumulative delta divergence alerts.
Trading with Order Flow
Delta Divergence
Delta divergence is one of the most reliable order flow signals. When price makes a new high but cumulative delta doesn't confirm with a new high, it reveals weakening buying pressure - buyers are no longer willing to be aggressive at higher prices. This bearish divergence often precedes pullbacks or reversals. Similarly, when price makes a new low but cumulative delta doesn't confirm (holds above its previous low), it suggests buyers are stepping in despite lower prices - a bullish divergence signal.
Trade divergence by waiting for price to reverse back below/above the divergent high/low, confirming the divergence is playing out. Place stops beyond the extreme and target the prior swing in the opposite direction.
Absorption Trading
To trade absorption, first identify a level where you see high volume without corresponding price movement - the footprint shows aggressive selling (or buying) but price doesn't break through. Wait for the aggression to exhaust itself and for price to begin moving away from the absorption zone. Enter when a candle closes in the direction away from absorption, with your stop placed just beyond the absorption zone.
Imbalance Breakouts
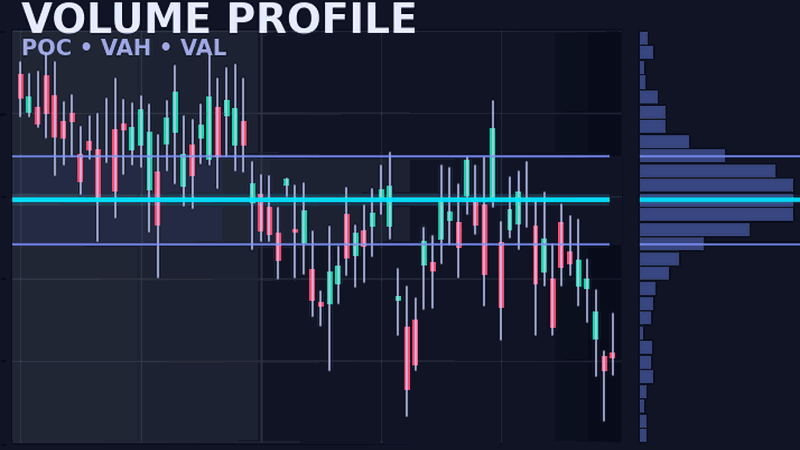
Stacked imbalances provide breakout confirmation. When price breaks a level and the footprint shows multiple consecutive price levels with buying imbalances, it confirms genuine directional pressure behind the move. Trade in the direction of stacked imbalances, targeting the next significant level or HVN from Volume Profile to see where volume accumulated at specific prices.
Confirmation Tool
Even if you don't trade order flow signals directly, delta serves as a powerful confirmation filter for other strategies. Taking a long setup from technical analysis? Check that delta is positive or at least neutral - negative delta on a long entry is a warning sign. Have a short setup? Ensure delta confirms with selling pressure. This simple filter can significantly improve win rates by avoiding trades where order flow contradicts your thesis.
NinjaScript Implementation
The following code demonstrates the conceptual approach to delta calculation in NinjaScript. Note that full order flow analysis requires tick-by-tick data with bid/ask attribution, which is only available with proper data subscriptions and tick replay enabled.
namespace NinjaTrader.NinjaScript.Indicators
{
    public class DeltaConcept : Indicator
    {
        private double cumulativeDelta;

        protected override void OnStateChange()
        {
            if (State == State.SetDefaults)
            {
                Description = "Delta Concept";
                Name = "DeltaConcept";
                Calculate = Calculate.OnEachTick;
                IsOverlay = false;
            }
        }

        protected override void OnBarUpdate()
        {
            // Note: Requires tick replay or real-time data
            // GetCurrentAskVolume() and GetCurrentBidVolume()
            // are only available with proper data subscription

            // Conceptual delta calculation
            // double askVolume = GetCurrentAskVolume();
            // double bidVolume = GetCurrentBidVolume();
            // double barDelta = askVolume - bidVolume;
            // cumulativeDelta += barDelta;

            // Plot values
            // Values[0][0] = barDelta;        // Per-bar delta
            // Values[1][0] = cumulativeDelta; // Running total
        }
    }
}
Important: Full order flow requires tick replay data or a real-time data provider with bid/ask volume. NinjaTrader's native Order Flow tools require a supported data feed. The methods GetCurrentAskVolume() and GetCurrentBidVolume() are only available when the data feed provides this information at the tick level.
Data Requirements
Order flow analysis has specific data requirements that differ from standard charting. Without proper data, delta calculations are impossible:
- Tick Replay: NinjaTrader 8's tick replay feature reconstructs historical tick-by-tick data from stored files. This allows order flow analysis on historical bars but is resource-intensive and requires adequate disk space.
- Real-time Data: For live trading, your data provider must supply bid/ask volume attribution at the tick level. Not all providers do - verify before subscribing.
- Supported Providers: Kinetick (NinjaTrader's recommended provider), Rithmic, CQG, and several others provide the necessary tick data. Check your provider's specifications.
- Standard OHLCV is Insufficient: Regular candlestick data showing only open, high, low, close, and total volume cannot support order flow analysis - there's no way to determine bid vs ask volume from OHLCV data alone.
- NinjaTrader 8 Order Flow+: NinjaTrader offers a built-in Order Flow+ package with footprint charts and volumetric analysis, available as a separate license from their platform license.
Settings & Configuration
When configuring order flow tools in NinjaTrader 8, several parameters affect how data is displayed and analyzed:
- Delta Display: Choose between per-bar delta (each bar's individual delta), cumulative delta (running total), or both displayed simultaneously.
- Imbalance Ratio: Set the threshold for highlighting volume imbalances. Common settings range from 200% to 400% - meaning ask volume must be 2-4x bid volume (or vice versa) to qualify as an imbalance.
- Footprint Style: Select from Bid x Ask (shows both values), Delta Profile (shows difference at each level), or Volume Profile (shows total volume at each price).
- Color Scheme: Configure colors for buying pressure (typically green/blue) and selling pressure (typically red/orange) to match your visual preferences.
- Historical Bars: Determine how many bars back to calculate and display order flow data. More bars require more memory and processing power.
Frequently Asked Questions
What is order flow analysis?
Order flow analysis examines the actual trades occurring in the market, distinguishing between buying pressure (trades at the ask) and selling pressure (trades at the bid). It reveals what's happening inside each bar that traditional charts hide.
How is delta calculated?
Delta is calculated as Ask Volume minus Bid Volume. Trades executed at the ask price are considered buying pressure, while trades at the bid are selling pressure. Positive delta means buyers dominated; negative delta means sellers dominated.
What is a footprint chart?
A footprint chart displays bid and ask volume at each price level within a bar. It shows where buyers and sellers were aggressive, revealing absorption, imbalances, and the internal structure of price movement.
What does positive/negative delta mean?
Positive delta indicates more aggressive buyers than sellers during that period (bullish pressure). Negative delta indicates more aggressive sellers (bearish pressure). The magnitude shows the strength of the imbalance.
How do I identify delta divergence?
Delta divergence occurs when price and cumulative delta move in opposite directions. If price makes a new high but cumulative delta doesn't confirm with a new high, it suggests weakening buying pressure and potential reversal.
Do I need special data for order flow?
Yes, order flow requires tick-level data with bid/ask volume attribution. Standard OHLCV data is insufficient. You need either tick replay for historical analysis or a real-time data provider that supplies bid/ask volume.