Overview
Candle math transforms subjective candlestick reading into objective, quantifiable metrics. Instead of interpreting a candle as "strong" or "weak" based on visual impression, candle math calculates exact percentages and ratios that describe the candle's character numerically. This enables systematic filtering of trade signals based on measurable criteria rather than discretionary interpretation.
The core insight is simple: every candlestick can be decomposed into measurable components - range (total height), body (open-to-close distance), upper wick, and lower wick. By calculating the relationships between these components, we can objectively determine whether a candle shows conviction (large body, small wicks) or indecision (small body, long wicks). This transforms statements like "that looks like a strong candle" into precise measurements like "body is 75% of range with minimal wick rejection."
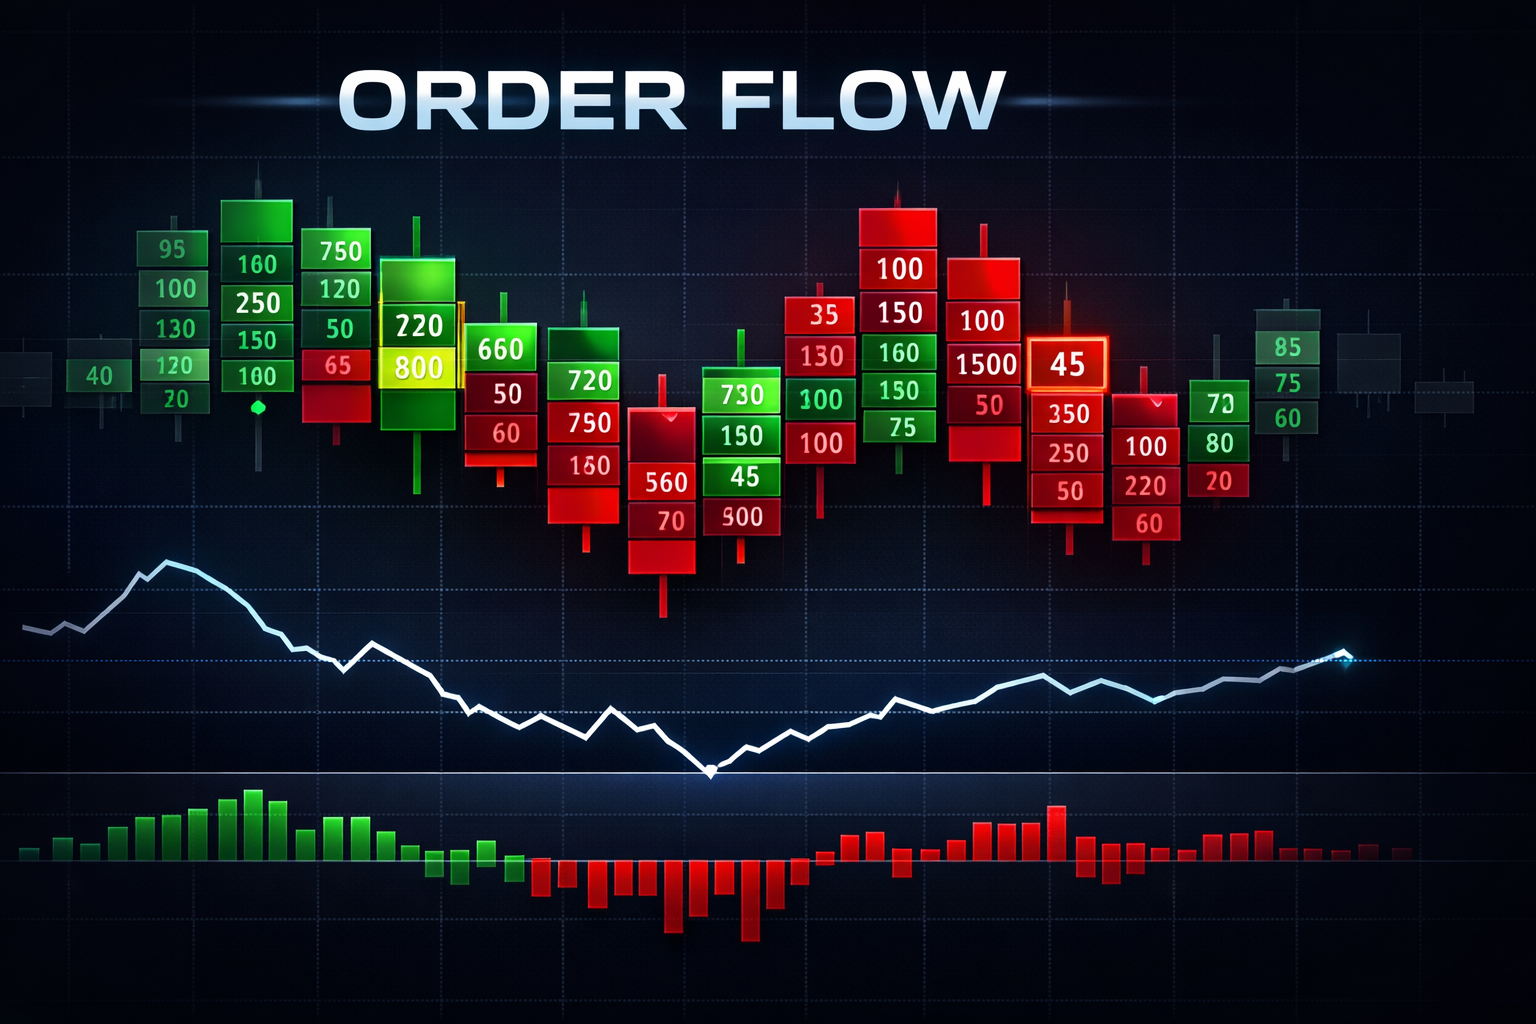
Candle math pairs well with Order Flow analysis for complete conviction assessment - the candle math tells you what happened to price, while order flow tells you how it happened in terms of buying and selling pressure. Together, they provide a comprehensive view of market participation on each bar.
Key Benefits
- Replace subjective candle reading with objective measurements
- Filter trade signals by candle strength thresholds
- Identify rejection candles at key support/resistance levels
- Automate pattern detection using precise calculations
Key Calculations
Range
Range is the simplest and most fundamental candle measurement - the total height of the candle from its lowest point to its highest point. It represents the full extent of price movement during that period.
Range = High - Low
Range is useful for measuring volatility and filtering out insignificant bars. Comparing current range to average range helps identify unusual activity - a range significantly larger than average may indicate important price action, while tiny range bars often represent consolidation or noise.
Body
Body measures the distance between open and close, representing the net price movement after the bar completed. Unlike range which shows total excursion, body shows the actual result - where price ended relative to where it started.
Body = |Close - Open|
The body is always positive (absolute value). Direction is determined separately: if Close > Open, the candle is bullish; if Close < Open, the candle is bearish. A large body relative to range indicates directional conviction; a small body relative to range indicates indecision.
Body Percentage
Body percentage is the core metric of candle math - what percentage of the total range is filled by the body. This single number characterizes the candle's conviction level.
bodyPercent = (Body / Range) * 100
Interpretation guidelines: 70%+ body percentage indicates strong conviction with minimal rejection - a confident directional move. 50-70% is moderate - some wicking but still directional. 30-50% shows increasing indecision - significant rejection occurred. Below 30% indicates high indecision, and 0% (or near-zero) is a doji where open equals close - maximum indecision.
Upper Wick
The upper wick measures the distance from the high of the candle to the top of the body. It represents the extent to which price was pushed higher during the bar but then rejected back down by the close.
Upper Wick = High - Max(Open, Close)
A long upper wick shows selling pressure entered the market after price reached the high, pushing it back down. Classic patterns involving upper wicks include shooting stars (small body, long upper wick after uptrend) and hanging man variations. Upper wick longer than body suggests the high was rejected strongly.
Lower Wick
The lower wick measures the distance from the bottom of the body to the low of the candle. It represents buying pressure that entered after price dropped to the low, pushing price back up before the close.
Lower Wick = Min(Open, Close) - Low
A long lower wick shows buyers defended lower prices, absorbing selling and pushing price back up. Classic patterns include hammer (small body, long lower wick after downtrend) and dragonfly doji. Lower wick longer than body suggests the low was rejected strongly - potential support.
Wick Ratio
Wick ratio measures the combined wick length as a percentage of total range - essentially the inverse of body percentage. It tells you what portion of the bar's movement was rejected.
wickRatio = ((Upper Wick + Lower Wick) / Range) * 100
Note that wickRatio + bodyPercent always equals 100%. High wick ratio (70%+) indicates significant rejection from both or one direction - indecision or reversal signal. Low wick ratio (30% or less) indicates clean, conviction move with minimal rejection. Use wick ratio to filter for high-conviction candles in trend-following strategies.
Professional Candle Analysis
Auto-calculate all candle metrics, filter signals by candle strength, and identify high-conviction setups with customizable thresholds.
Trading Applications
Signal Filtering
The most practical application of candle math is filtering trade signals by candle strength. Instead of taking every signal from your strategy, add a candle math filter: only take buy signals when the signal candle has body percentage above 60%. Reject entries on doji or high-wick candles where conviction is unclear. Require range greater than average range for breakout trades to ensure the move has substance.
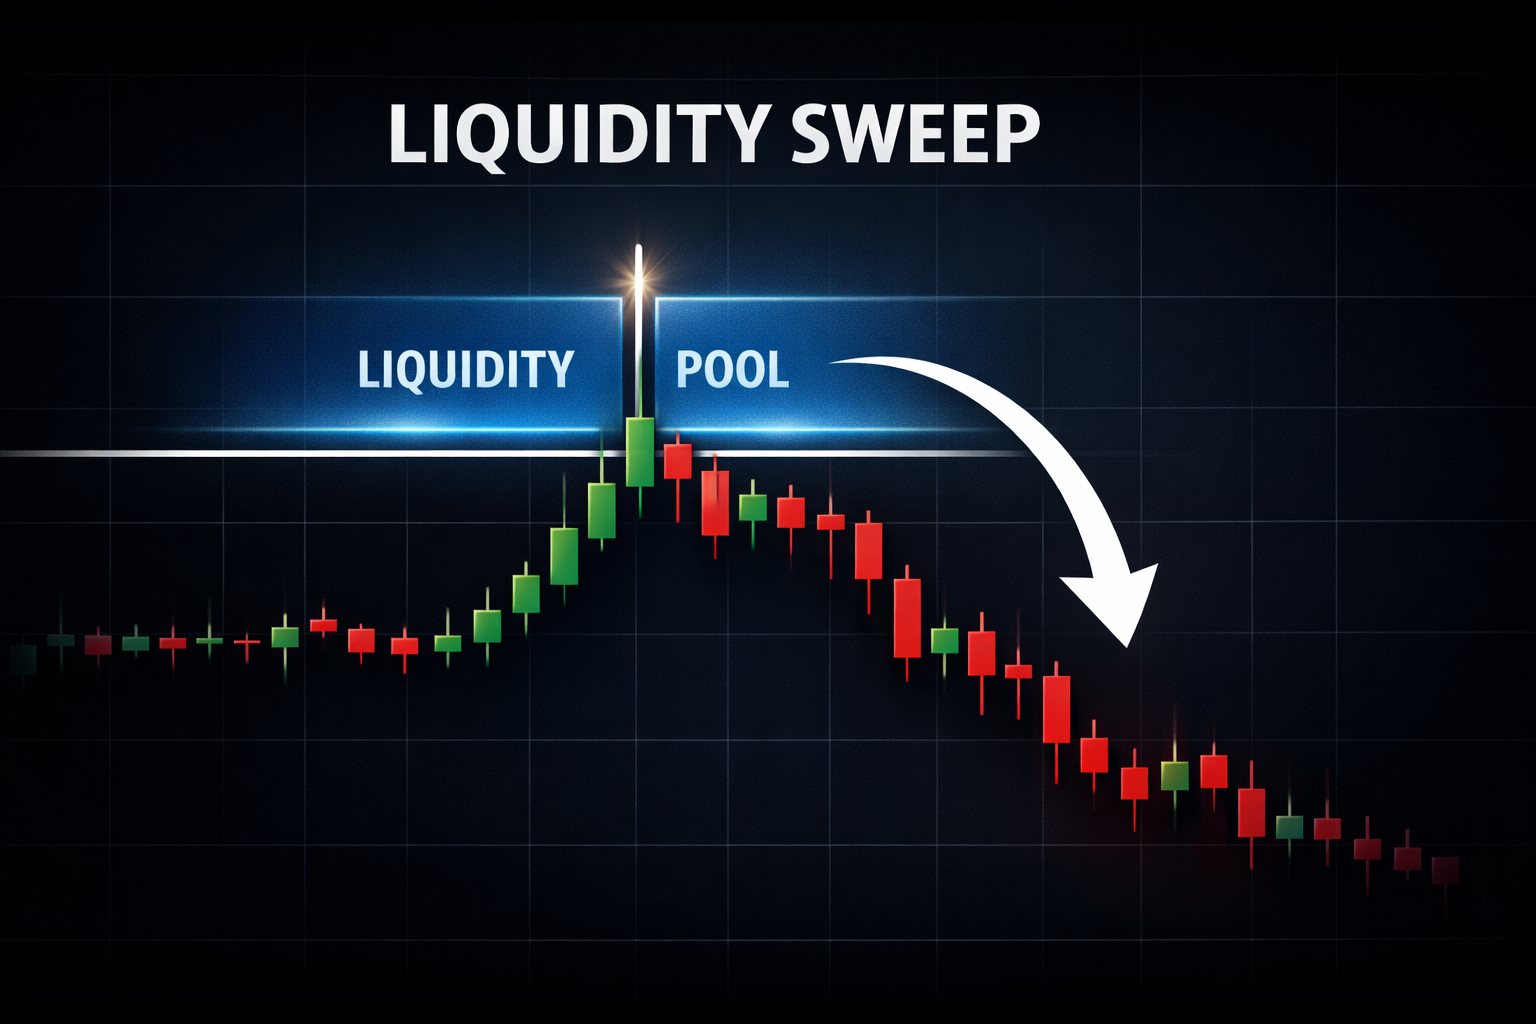
Use candle math to filter Liquidity Sweep entries - only trade sweeps with strong rejection candles that show clear wick into the liquidity zone and strong body closing back in range.
Reversal Identification
Candle math excels at quantifying reversal signals. At support, look for candles with long lower wicks (lower wick > 2x body) indicating buyers defended the level. At resistance, look for long upper wicks (upper wick > 2x body) showing sellers rejected higher prices. These specific ratios turn "it looks like rejection" into a measurable, backtestable condition.
Trend Strength
Monitor body percentage over consecutive candles to gauge trend strength. Strong trends show consecutive high body percentage candles (70%+) as price moves decisively. When body percentage starts decreasing - from 75% to 60% to 45% - the trend is showing signs of exhaustion. Similarly, increasing wick ratio over several candles suggests the trend is meeting resistance and may be weakening.
Entry Timing
Use candle math to time entries more precisely. Wait for a confirmation candle with high body percentage before entering a position. Avoid entering on indecision candles - if you have a setup but the trigger bar is a doji, wait for the next bar to confirm direction. Rank multiple setups by candle quality to determine which deserves capital allocation.
NinjaScript Implementation
The following NinjaScript code provides a working implementation of candle math calculations. This indicator plots body percentage and wick ratio, and includes logic for detecting basic patterns like hammer and shooting star.
namespace NinjaTrader.NinjaScript.Indicators
{
    public class CandleMath : Indicator
    {
        [NinjaScriptProperty]
        [Range(1, int.MaxValue)]
        [Display(Name = "Average Period", Order = 1)]
        public int AveragePeriod { get; set; }

        protected override void OnStateChange()
        {
            if (State == State.SetDefaults)
            {
                Description = "Candle Math Calculations";
                Name = "CandleMath";
                Calculate = Calculate.OnBarClose;
                IsOverlay = false;
                AveragePeriod = 14;

                AddPlot(Brushes.DodgerBlue, "Body%");
                AddPlot(Brushes.Orange, "WickRatio");
            }
        }

        protected override void OnBarUpdate()
        {
            if (CurrentBar < 1) return;

            double range = High[0] - Low[0];
            if (range == 0)
            {
                Values[0][0] = 0;  // Body %
                Values[1][0] = 0;  // Wick Ratio
                return;
            }

            double body = Math.Abs(Close[0] - Open[0]);
            double bodyPercent = (body / range) * 100;

            double upperWick = High[0] - Math.Max(Open[0], Close[0]);
            double lowerWick = Math.Min(Open[0], Close[0]) - Low[0];
            double wickRatio = ((upperWick + lowerWick) / range) * 100;

            Values[0][0] = bodyPercent;
            Values[1][0] = wickRatio;

            // Optional: Check for patterns
            bool isBullish = Close[0] > Open[0];
            bool isHammer = isBullish && lowerWick > body * 2 && upperWick < body * 0.5;
            bool isShootingStar = !isBullish && upperWick > body * 2 && lowerWick < body * 0.5;
        }
    }
}
This is a working example that plots body percentage and wick ratio as separate indicators. The pattern detection logic (hammer, shooting star) can be extended to include alerts, draw objects on the chart, or integrate with automated strategies. You can add additional plots for specific wick measurements or create custom thresholds for your trading style.
Settings & Configuration
When configuring candle math indicators in NinjaTrader 8, consider these parameters:
- Body % Threshold: Set the minimum body percentage to consider a candle "strong" for filtering purposes. Default is typically 60%, but adjust based on the instrument's typical candle character.
- Wick Ratio Threshold: Set the maximum wick ratio for conviction candles. Default around 40% - candles with higher wick ratios show too much rejection for trend trades.
- Range Filter: Minimum range in ticks to consider a candle significant. Filters out noise bars that are too small to provide meaningful information.
- Average Period: Number of bars used to calculate average range for comparison. Typically 14-20 bars provides a stable reference.
- Display: Choose which metrics to display on the chart - body percentage, wick ratio, individual wick lengths, or pattern markers.
Frequently Asked Questions
What is candle math?
Candle math is the quantitative analysis of candlestick components: range, body, wicks. Instead of subjectively reading candles, you calculate precise percentages and ratios to objectively measure candle strength and character.
How do I calculate body percentage?
Body percentage is calculated as (Body / Range) * 100, where Body = |Close - Open| and Range = High - Low. A body percentage of 70% means the body fills 70% of the candle's total height.
What do long wicks indicate?
Long wicks indicate rejection and indecision. A long upper wick shows selling pressure pushed price down from the high. A long lower wick shows buying pressure lifted price from the low. Both suggest the initial move was rejected.
How do I use candle math in trading?
Use candle math to filter signals and confirm entries. Only take trades when the signal candle has high body percentage (strong conviction). Avoid entries on doji or high-wick candles. Use wick analysis to identify reversals at key levels.
What body percentage indicates a strong move?
A body percentage of 70% or higher generally indicates a strong, conviction move. 50-70% is moderate. Below 50% shows increasing indecision. Below 30% or doji suggests high indecision and potential reversal.