What is Volume Profile?
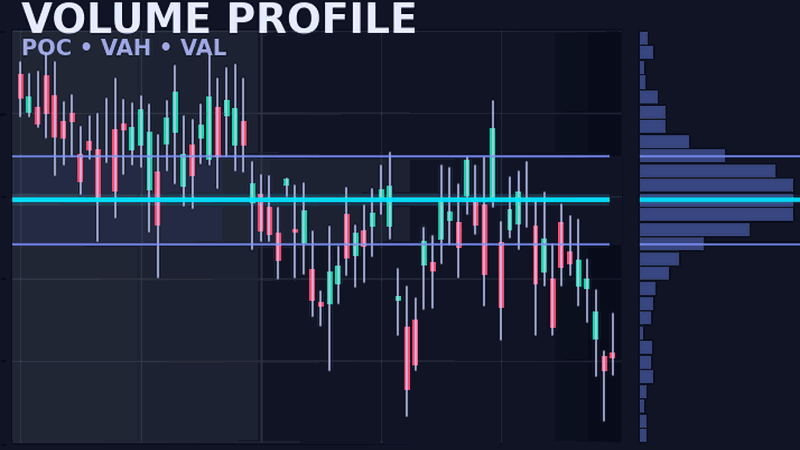
Volume Profile is a charting tool that displays trading volume distributed across price levels rather than time periods. While a traditional volume bar shows how much was traded during each candle, Volume Profile shows how much was traded at each price, revealing where the market found the most agreement between buyers and sellers.
This distinction is crucial for understanding market behavior. Traditional volume tells you when activity occurred, but Volume Profile tells you where activity occurred. Knowing where traders concentrated their activity helps you identify key levels where the market is likely to react in the future.
Volume Profile originated from the work of Peter Steidlmayer at the Chicago Board of Trade in the 1980s. Steidlmayer developed Market Profile as a way to visualize market activity and understand price acceptance, laying the groundwork for the volume-at-price analysis traders use today. His insights into auction theory continue to influence how traders interpret market structure.
For traders, Volume Profile provides an objective way to identify support and resistance levels based on actual trading activity, not just price patterns. These levels represent prices where significant positions were built, creating areas where traders are likely to defend their entries or where new participants may step in.
The Auction Theory Foundation
To truly understand Volume Profile, you need to grasp the concept of auction theory. Markets are not random: they are driven by the constant negotiation between buyers and sellers seeking to discover fair value. Every trade represents a moment where a buyer and seller agreed on price, even if briefly.
When volume concentrates at a particular price level, it signals that both sides found that price acceptable. High volume at a price means many participants agreed it was fair, making it a consensus zone. Low volume, on the other hand, indicates rejection: the market moved through that price quickly because participants did not find it attractive.
The auction process creates distinct market structures. When the market is in balance, price rotates within a range as buyers and sellers find equilibrium. When imbalance occurs, one side becomes more aggressive, pushing price to explore new territory until a new balance point is discovered.
Understanding this framework transforms how you view price movement. Instead of seeing random fluctuations, you begin to see the market's continuous search for fair value. Volume Profile visualizes this search, showing you where the market has found acceptance and where it has met rejection.
Key Volume Profile Concepts
Point of Control (POC)
The Point of Control is the single price level with the highest traded volume within a profile period. Think of it as the market's "fairest price," the level where buyers and sellers found the most agreement. Visually, the POC appears as the longest bar in the Volume Profile histogram.
The POC acts as a magnet for price. When price moves away from the POC, there is often a gravitational pull back toward this equilibrium level. Many traders watch for price to retest the previous session's POC, as this level represents where the most business was conducted and where participants may look to add to positions.
Developing versus fixed POC matters. During a trading session, the POC may shift as new volume data arrives. A developing POC helps you understand the current session's evolution. Once a session closes, the POC becomes fixed and serves as a reference level for future sessions.
Value Area (VA)
The Value Area encompasses approximately 70% of the total volume traded within a profile period. This percentage comes from statistical principles: one standard deviation from the mean captures about 68.2% of data in a normal distribution. Traders typically round to 70% for simplicity.
The Value Area represents the range where most trading occurred, essentially where the market agreed on fair value during that period. When price is inside the Value Area, the market is in balance. When price moves outside the Value Area, it is exploring whether participants will accept new prices as fair.
Calculating the Value Area starts at the POC and expands outward. The algorithm adds volume rows above and below the POC alternately, selecting whichever side contributes more volume, until 70% of total volume is captured. This process creates the Value Area's upper and lower boundaries.
VAH and VAL
The Value Area High (VAH) marks the upper boundary of the Value Area and typically acts as resistance. When price approaches the VAH from below, traders watch for rejection (potential short entry) or acceptance above (breakout signal). The Value Area Low (VAL) functions similarly as support on the lower boundary.
These levels gain significance from the prior session. Yesterday's VAH, POC, and VAL are standard reference levels for day traders. Opening relative to these levels provides early clues about likely session behavior: inside the Value Area suggests rotation, outside suggests potential for directional movement.
High Volume Nodes (HVN) and Low Volume Nodes (LVN)
High Volume Nodes are price levels with significant trading activity, appearing as thick horizontal bars in the profile. These areas represent consensus zones where many traders built positions. HVNs tend to act as support or resistance because traders have financial and psychological attachment to prices where they entered.
Low Volume Nodes are the opposite: thin areas in the profile where minimal trading occurred. The market passed through these prices quickly, rejecting them as fair value. When price revisits an LVN, expect rapid movement because there are few resting orders to slow the price.
The interaction between HVNs and LVNs creates tradeable scenarios. Price tends to consolidate around HVNs and accelerate through LVNs. Understanding this dynamic helps with stop placement, target selection, and expectation management for how price will behave at different levels.
Ready to Apply Volume Profile?
Get professional Volume Profile indicators with automatic POC, Value Area, and HVN/LVN detection for NinjaTrader 8.
Beginner Trading Strategies
With the concepts in place, let's look at practical strategies beginners can apply. Start simple and add complexity as you gain experience. The goal is to build confidence with basic setups before advancing to more nuanced approaches.
Session Profile Basics
Begin each trading day by marking the prior session's key levels: VAH, POC, and VAL. Many traders draw horizontal lines at these prices before the market opens. This simple preparation gives you objective reference points for the day's trading decisions.
Distinguish between Regular Trading Hours (RTH) and Extended Trading Hours (ETH) profiles. RTH captures the main session with the highest institutional participation, making those levels most reliable. ETH profiles can provide additional context but typically carry less weight due to lower volume.
Watch how the market opens relative to yesterday's Value Area. An open inside the Value Area suggests rotational, mean-reverting behavior. An open outside the Value Area signals the market is exploring new territory and may trend or attempt to return to value.
The 80% Rule Simplified
The 80% Rule is one of the most cited Volume Profile concepts. When price opens outside the previous Value Area, then enters the Value Area and stays inside for two consecutive 30-minute periods, there is approximately an 80% probability that price will travel to the opposite side of the Value Area.
80% Rule Checklist
- 1. Price opens outside yesterday's Value Area (above VAH or below VAL)
- 2. Price enters the Value Area (crosses VAH from above or VAL from below)
- 3. Price remains inside VA for two consecutive 30-minute periods
- 4. Target: opposite side of Value Area (VAL if entered from VAH, VAH if entered from VAL)
This rule works best on liquid futures markets where the statistical relationship holds. On thinner instruments or during unusual market conditions, the probabilities may differ. Always use proper risk management regardless of the setup's historical probability.
Common Setups for Beginners
Start with these straightforward setups that combine Volume Profile levels with basic price action:
- POC Retest: When price returns to the previous session's POC, watch for a reaction. A bullish candle pattern (like a hammer or engulfing) at the POC suggests a long entry. A bearish pattern suggests a short. Place stops beyond the opposite side of the POC.
- VAH Rejection Short: When price rallies into the VAH and shows rejection (wicks, bearish candles), consider a short entry. Target the POC initially, then VAL if momentum continues. Stop above the recent swing high.
- VAL Bounce Long: When price drops to the VAL and shows buying interest (long lower wicks, bullish reversal candles), consider a long entry. Target the POC, then VAH. Stop below the recent swing low.
Keep it simple. These basic setups, combined with patience and proper position sizing, provide a foundation for Volume Profile trading. Complexity can come later as you develop pattern recognition and market intuition.
Getting Started with Volume Profile
Ready to apply Volume Profile to your trading? Here's a practical path forward for beginners.
Start with daily profiles. Before diving into intraday session profiles, spend time studying daily composite profiles on your preferred instruments. Notice how price reacts at significant volume nodes over days and weeks. This builds intuition for how Volume Profile levels work at scale.
Paper trade first. Mark your levels before the session opens, then observe how price interacts with those levels throughout the day. Track which setups work and which fail. Only risk real capital after you have demonstrated consistency in identifying opportunities.
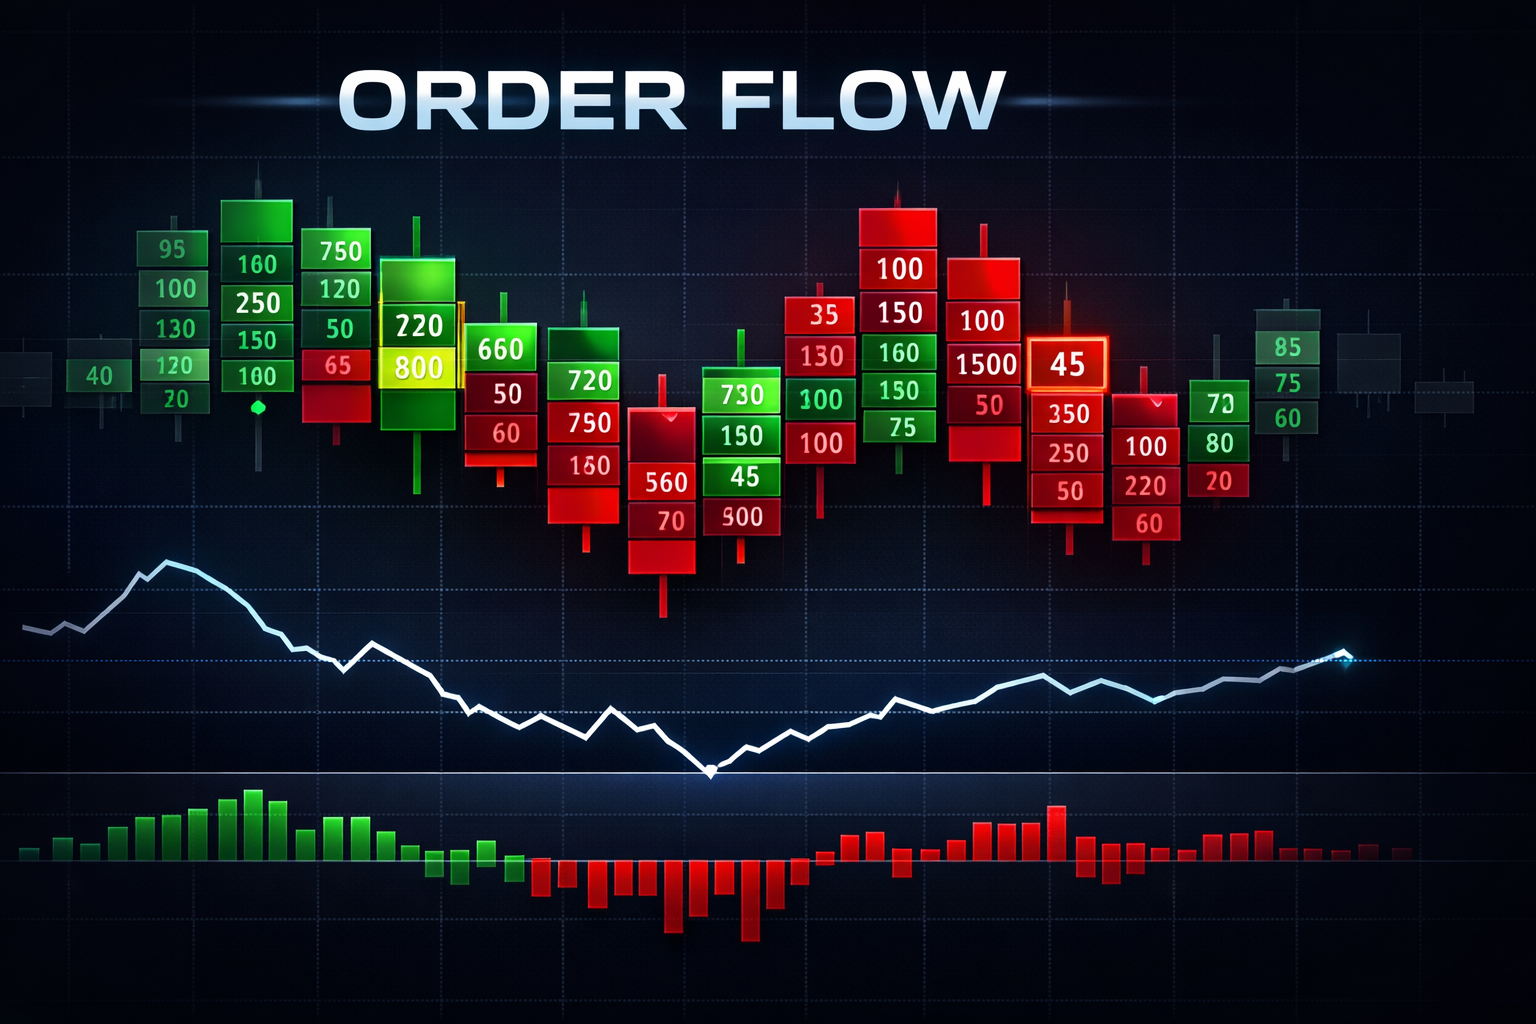
Combine with other tools. Volume Profile works well alongside other analysis methods. Consider pairing it with Order Flow analysis to see buying and selling pressure at key levels, or use it to filter entries from your existing strategy.
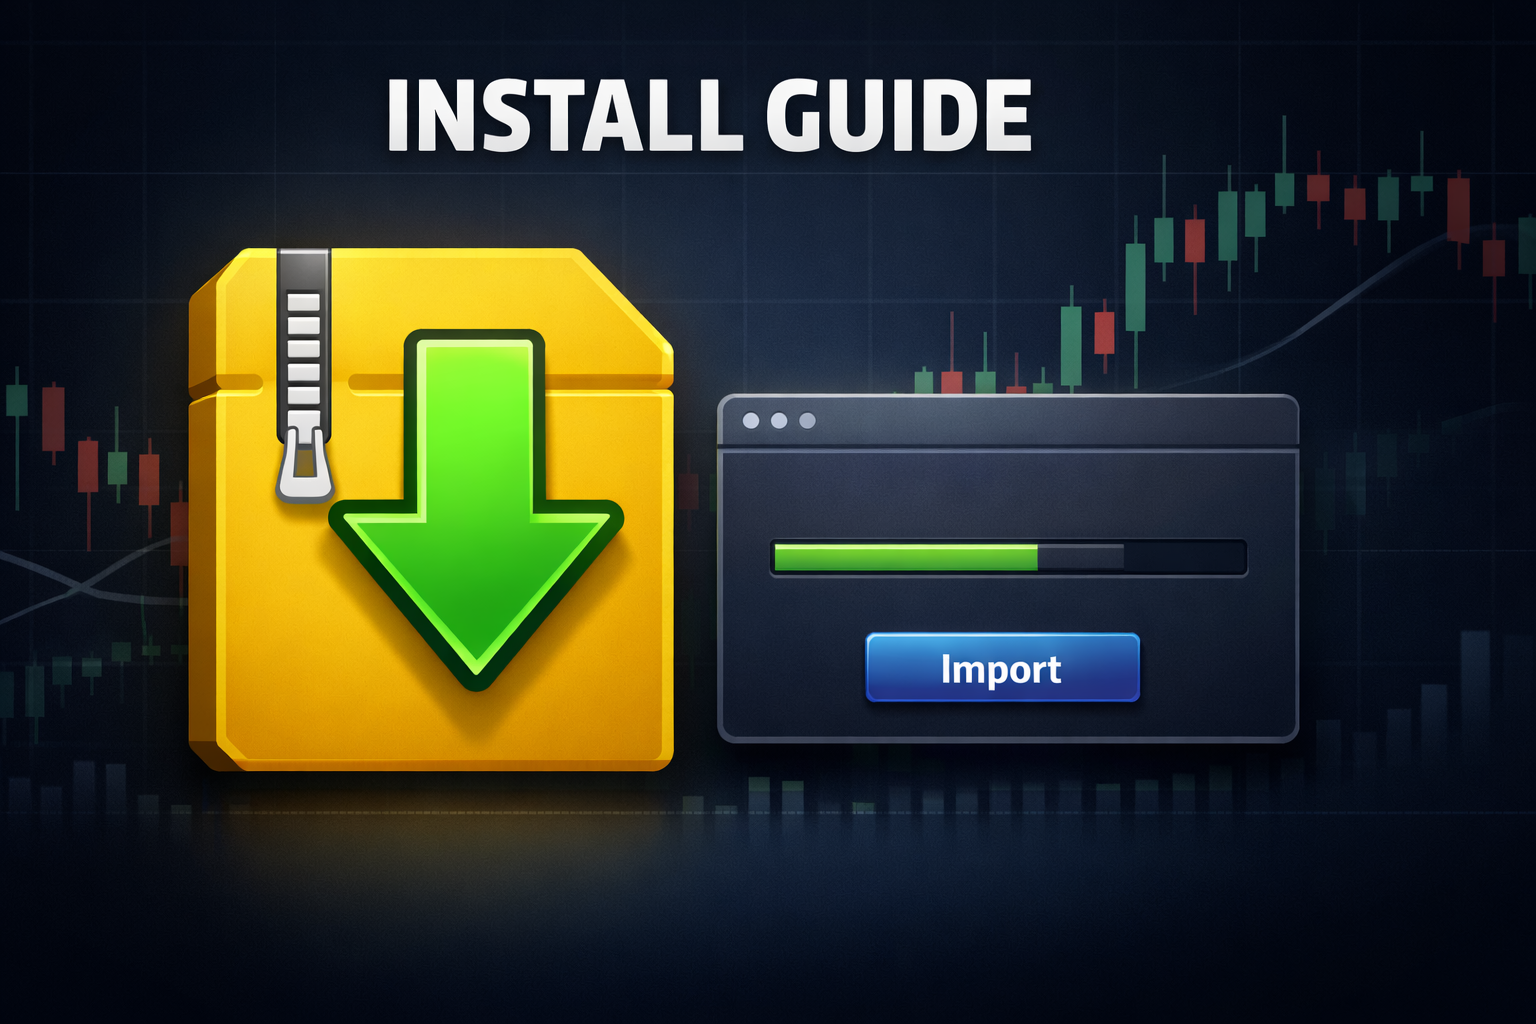
For NinjaTrader setup instructions, settings configuration, and NinjaScript implementation details, see our comprehensive Volume Profile Indicator Guide. That guide covers the technical aspects of implementing Volume Profile on your charts, while this article focused on the conceptual foundation and trading applications.
Summary: Volume Profile Essentials
- Volume Profile shows volume at each price level, revealing market consensus
- POC (Point of Control) is the price with highest volume, the "fairest price"
- Value Area contains 70% of volume, with VAH and VAL as boundaries
- HVNs attract price (support/resistance); LVNs repel price (fast moves)
- Start with prior session levels (VAH, POC, VAL) as your daily framework