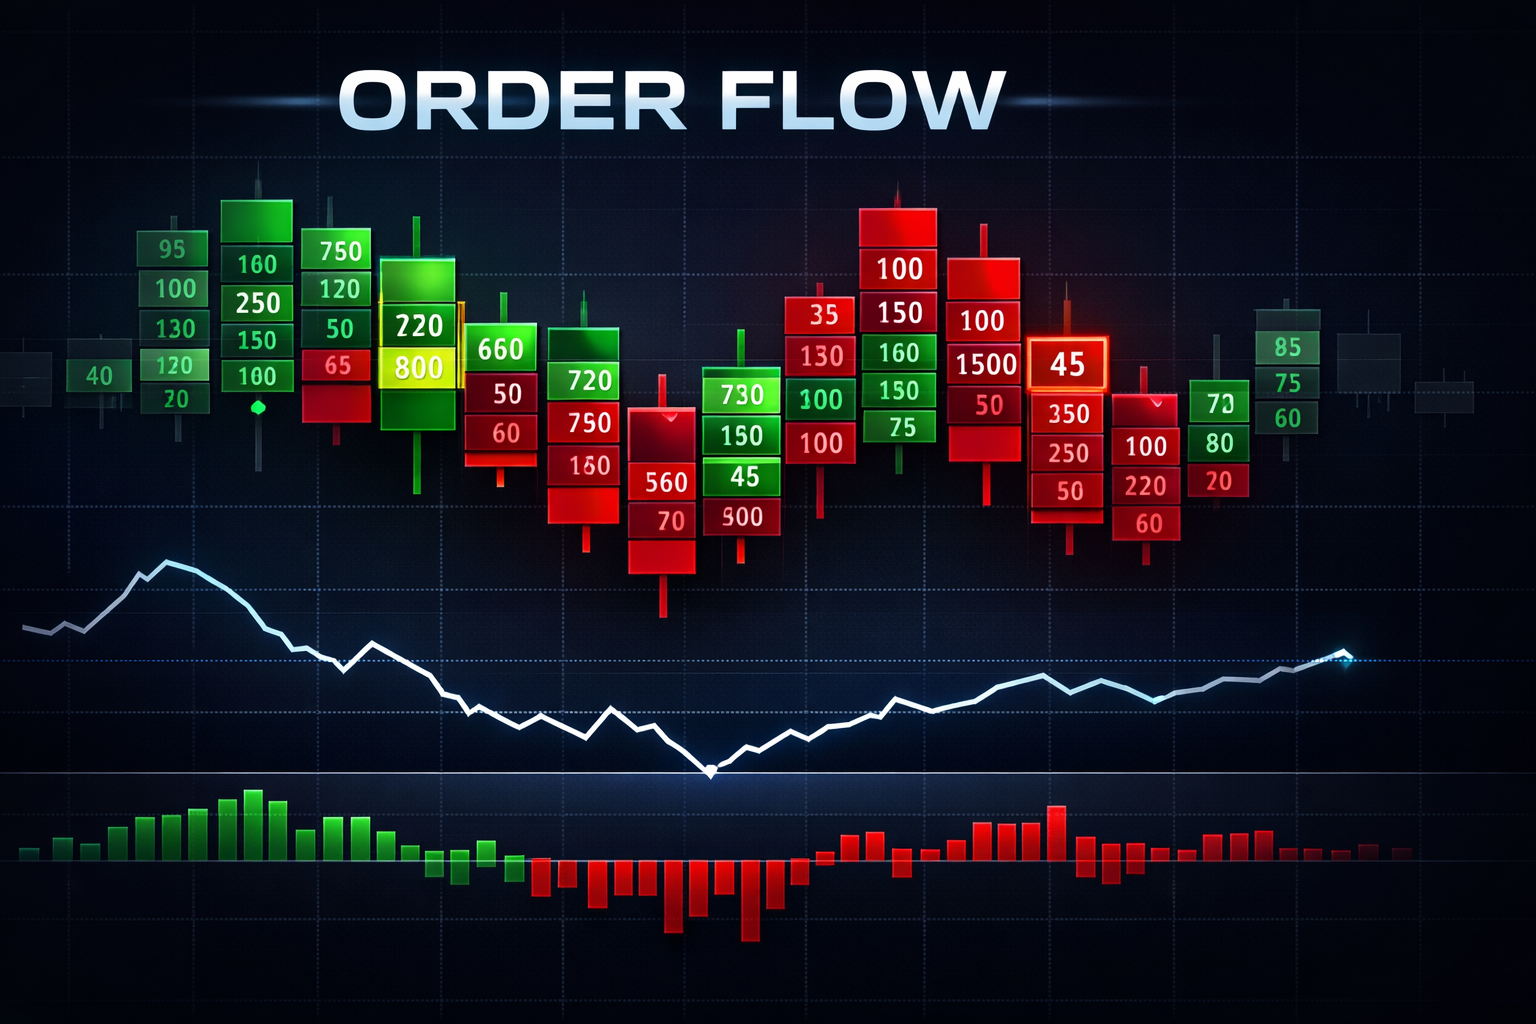
What is Order Flow?
Order flow is the study of buying and selling activity at each price level. While traditional charts show you what price did, order flow shows you why price moved. It reveals the ongoing battle between buyers and sellers, letting you see aggressive market orders hitting the bid and ask in real-time.
Think of a traditional candlestick chart as watching a football game's scoreboard: you see the score change, but you don't see the plays. Order flow is like watching the actual game. You see every tackle, every pass, every formation. You understand not just that the score changed, but how and why it happened.
Every futures contract traded represents a transaction between a buyer and a seller. When a trader places a market order to buy, they are "lifting the offer" — paying the asking price to get filled immediately. When they sell with a market order, they are "hitting the bid." Order flow analysis tracks these aggressive orders because they represent conviction and urgency.
This matters because limit orders (passive orders sitting in the book) don't move price. Market orders do. By tracking where aggressive buying and selling occurs, you gain insight into where real demand and supply exist. A price level absorbed heavy selling without dropping? That's genuine demand. Price rallied on low buying volume? That move may lack conviction.
Why Order Flow Matters for Retail Traders
Order flow trading was once the exclusive domain of professional floor traders and institutional desks. They had access to the tape (Time & Sales) and could see order book depth that retail traders couldn't. The playing field has changed. Modern platforms like NinjaTrader now provide sophisticated order flow visualization tools that put this information at your fingertips.
NinjaTrader recently expanded into Europe, specifically highlighting order flow visualization as a key feature for the next generation of retail futures traders. This isn't a coincidence. The industry recognizes that traders who understand order flow have an edge over those relying solely on lagging indicators.
Order flow helps answer critical trading questions: Is this breakout real or a fake-out? Are buyers stepping in at support, or is it about to fail? Is that big green candle driven by aggressive buying, or just short covering? These questions can't be answered by candlesticks alone, but order flow provides the evidence.
For NQ (Nasdaq 100 futures) traders especially, order flow analysis is invaluable. NQ is one of the most liquid futures contracts, with tight spreads and significant institutional participation. This liquidity creates clean order flow data where patterns are more reliable than in thinner markets.
Delta: The Foundation of Order Flow
Delta is the core concept in order flow analysis. It measures the difference between buying volume and selling volume. Specifically, delta equals the volume traded at the ask (aggressive buying) minus the volume traded at the bid (aggressive selling).
Delta Formula
Delta = Volume at Ask − Volume at Bid
- Positive Delta: More aggressive buying (buyers lifting offers)
- Negative Delta: More aggressive selling (sellers hitting bids)
- Zero/Neutral Delta: Balanced buying and selling pressure
When you see a candle with a delta of +500, it means 500 more contracts were traded at the ask than at the bid during that bar. Buyers were more aggressive than sellers. Conversely, a delta of -500 means sellers dominated.
Here's where it gets interesting: delta and price direction don't always align. A bullish candle with negative delta suggests the rally was driven by sellers covering (buying back shorts) rather than new buying interest. A bearish candle with positive delta might indicate buyers absorbing selling pressure — a potential support level forming.
This divergence between price and delta is one of the most powerful signals in order flow analysis. When price makes a new high but delta is declining, it often warns of weakening momentum. When price makes a new low but delta is becoming less negative, buyers may be stepping in.
Bar Delta vs. Price Level Delta
Delta can be measured in two ways: per bar (time-based) or per price level (footprint). Bar delta tells you the net buying/selling pressure during a specific time period. Price level delta (seen in footprint charts) shows you exactly where within that bar the buying and selling occurred.
Both views are useful. Bar delta gives you the quick summary: "Were buyers or sellers more aggressive this candle?" Price level delta provides granular detail: "At which specific prices were buyers most aggressive?"
Cumulative Delta: Tracking the Bigger Picture
Cumulative delta is the running total of delta over time. It adds up each bar's delta to show whether buyers or sellers have been dominant over the session, day, or whatever period you're analyzing. Think of it as a scoreboard showing who's winning the battle.
When cumulative delta is rising, aggressive buyers have dominated. When it's falling, aggressive sellers have controlled the action. The slope and direction of cumulative delta tell you the story of the session's order flow.
The power of cumulative delta lies in comparing it to price. In a healthy uptrend, both price and cumulative delta should rise together. If price keeps making new highs but cumulative delta is flat or declining, it's a warning sign. This divergence suggests buyers are losing steam, and the rally may be running on fumes.
Cumulative Delta Divergences
- Bearish: Price makes higher high, cumulative delta makes lower high → weakening buying pressure
- Bullish: Price makes lower low, cumulative delta makes higher low → sellers losing strength
- Confirmation: Price and cumulative delta move together → trend has conviction
Many traders display cumulative delta as a line or histogram below their price chart. When the cumulative delta line confirms price action, they trade with confidence. When it diverges, they become cautious or look for reversal opportunities.
Ready to See Order Flow?
Get professional Order Flow indicators with delta, cumulative delta, and footprint visualization for NinjaTrader 8.
Footprint Charts: Seeing Inside the Candle
Footprint charts (also called order flow charts or cluster charts) show the buying and selling volume at each price level within a bar. Instead of seeing just open, high, low, and close, you see exactly how much volume traded at each tick — and whether that volume was aggressive buying or selling.
A typical footprint chart displays bid volume and ask volume side by side at each price. Some formats show the delta (bid x ask), others show volume profile with delta coloring, and others show imbalances. The specific format matters less than understanding what you're looking at: the granular breakdown of buying and selling at every price.
Reading a Bid x Ask Footprint
The most common footprint format shows two numbers at each price level: bid volume on the left, ask volume on the right. For example, "150 x 280" means 150 contracts traded at the bid (sellers) and 280 traded at the ask (buyers) at that price. The delta at that level is +130 (280 - 150).
Some traders prefer "delta footprints" that simply show the net delta at each price, color-coded green for positive and red for negative. This simplifies the display and makes it easier to see where buying or selling dominated.
Imbalances
An imbalance occurs when buying or selling at a price level significantly exceeds the opposite side. The typical threshold is 300% — if ask volume is three times bid volume at a price, that's a buying imbalance. If bid volume is three times ask volume, that's a selling imbalance.
Imbalances highlight prices where one side showed exceptional aggression. A stack of buying imbalances at the bottom of a candle (especially if price reversed higher) suggests strong demand. Selling imbalances at the top of a candle that then reverses down indicate supply.
These imbalance levels often act as support or resistance on retests. Traders who established positions at those prices will defend them. Knowing where imbalances occurred gives you objective levels to watch.
Key Order Flow Patterns
Absorption
Absorption occurs when passive limit orders absorb aggressive market orders without price moving significantly. Imagine sellers hitting the bid with 500 contracts, but price doesn't drop because buyers have 500+ contracts sitting as limit orders at that price. The selling was absorbed.
On a footprint chart, absorption appears as heavy negative delta at a price level that price doesn't break through. You see lots of selling (high bid volume), but price holds or even moves higher. This is bullish absorption — buyers are absorbing all that selling and want more.
Bearish absorption is the opposite: heavy buying at a price (high ask volume) that price doesn't break above. Sellers are absorbing buying pressure and preventing the advance.
Absorption at key levels (prior day high/low, round numbers, VWAP) is particularly meaningful. Institutions often use these levels to build positions, and absorption is evidence of their activity.
Exhaustion
Exhaustion patterns signal that a move is running out of steam. After a rally, an exhaustion pattern shows heavy buying (positive delta) at the highs but price failing to continue higher or starting to reverse. Buyers gave it everything they had, but sellers stepped in and stopped them.
Look for exhaustion at the extremes of moves, especially after extended trends. A big spike in delta at a high that immediately reverses is a classic exhaustion signature. It often marks at least a short-term top.
Initiative vs. Responsive Activity
Initiative activity is aggressive order flow that moves price into new territory. Responsive activity is order flow that occurs at established levels (like Value Area boundaries) where participants are responding to price visiting known value.
When you see strong buying initiative (positive delta pushing price to new highs), the market is exploring new territory with conviction. If the buying only appears when price dips to support (responsive), buyers are defending levels but not driving the market higher.
This distinction helps with trend assessment. Trends need initiative activity to continue. When you only see responsive buying on dips but no initiative buying at highs, the rally may be stalling.
Practical NQ Examples
Let's walk through how order flow concepts apply to trading NQ futures.
Scenario 1: Breakout Confirmation
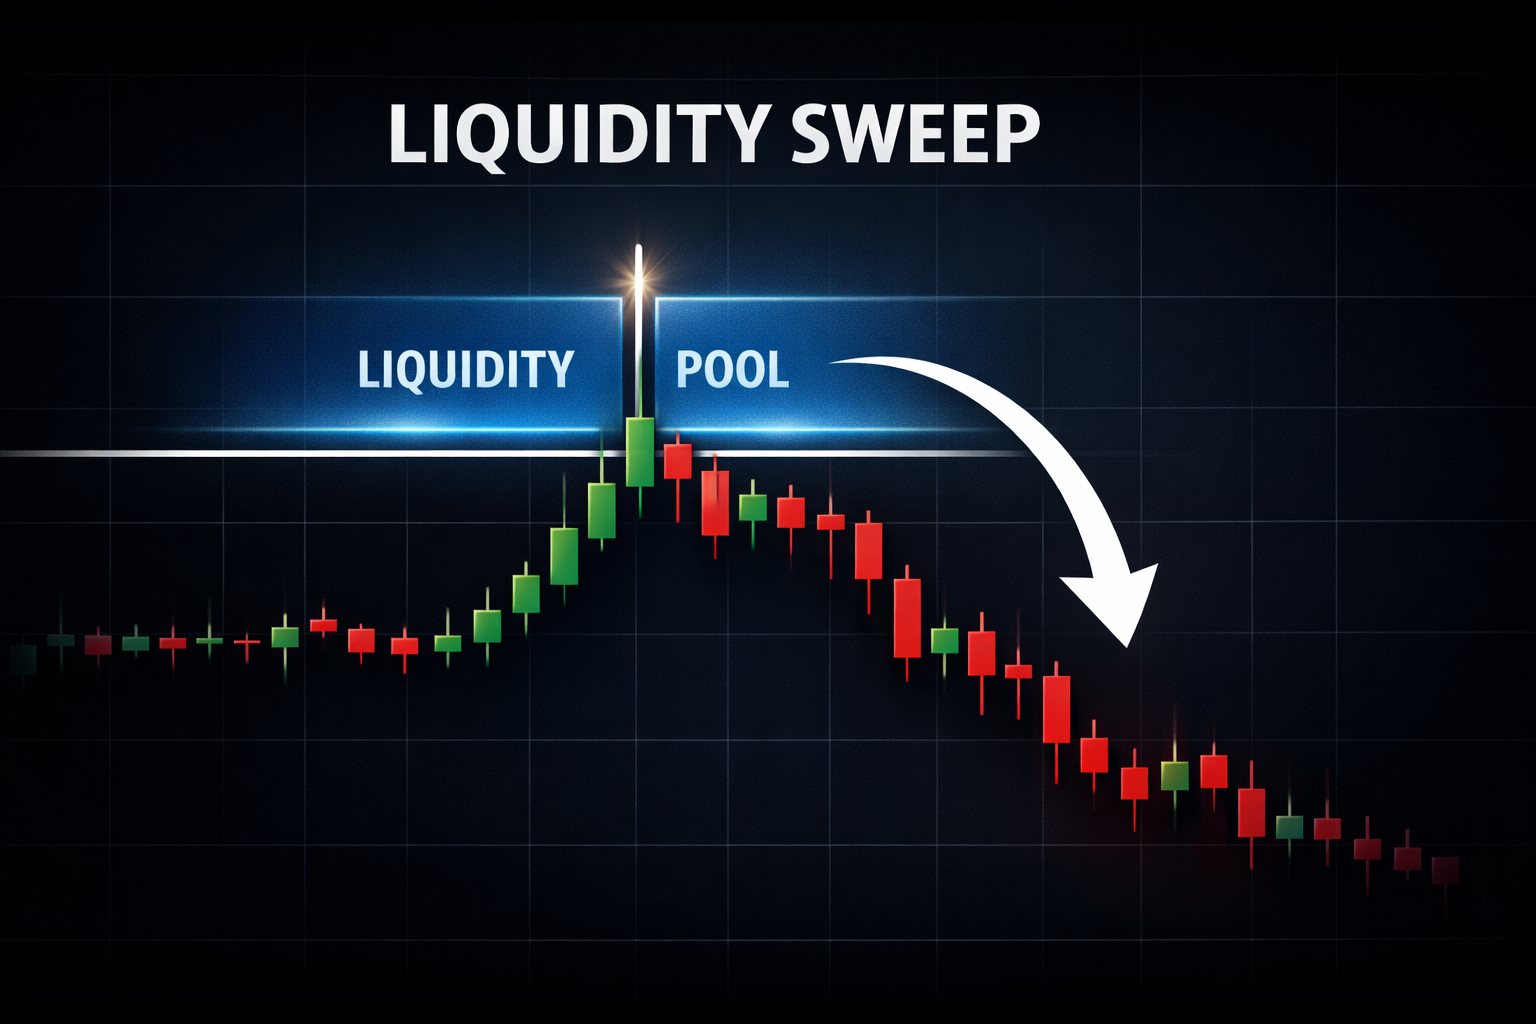
NQ approaches the prior day high. Without order flow, you might hesitate: is this breakout real or a stop hunt? With order flow, you watch the delta. If price breaks the high with strong positive delta and buying imbalances in the footprint, buyers are aggressively pushing through. The breakout has conviction.
If price pops above the high but delta is weak or negative (suggesting short covering rather than new buying), be skeptical. The move may fail. Wait for a pullback and reassess order flow on the retest.
Scenario 2: Support Test
NQ drops to the Value Area Low from the prior session. You're watching for a bounce. Order flow shows heavy selling (negative delta) as price hits the VAL, but price stabilizes and starts to turn up. Looking at the footprint, you see absorption — lots of bid volume was hit, but price didn't break lower.
This is evidence that buyers are defending the level. A long entry with a stop below the swing low and a target at the POC is a reasonable trade based on order flow confirmation of support.
Scenario 3: Divergence Warning
NQ rallies for three hours, making a series of higher highs. You're long and considering adding to your position. But cumulative delta hasn't made a new high in the last hour. Price is pushing higher on weakening buying pressure.
This divergence is a warning. Rather than adding, you might tighten your stop or take partial profits. The order flow is telling you that while price looks strong, the underlying buying pressure is fading. Often, price follows order flow after a lag.
Getting Started with Order Flow
Ready to incorporate order flow into your trading? Here's a practical path forward.
Start with cumulative delta. Before diving into footprint charts, add a simple cumulative delta indicator below your price chart. Watch it for a few sessions without trading. Notice how it moves relative to price. Look for divergences at highs and lows. This builds foundational pattern recognition.
Keep your charts clean. Order flow adds information, but too much information creates paralysis. Start with just cumulative delta. Once comfortable, add a basic footprint view. Don't run five order flow tools simultaneously. Simplicity aids decision-making.
Focus on key levels. Order flow is most valuable at important prices: prior day high/low, VWAP, round numbers, overnight high/low. Don't try to read order flow at random prices in the middle of a range. Save your attention for levels that matter.
Paper trade first. Observe how order flow behaves at your setups. When you see absorption at support, note what happens next. Track whether breakouts with strong delta continue or fail. Build confidence through observation before risking capital on order flow reads.
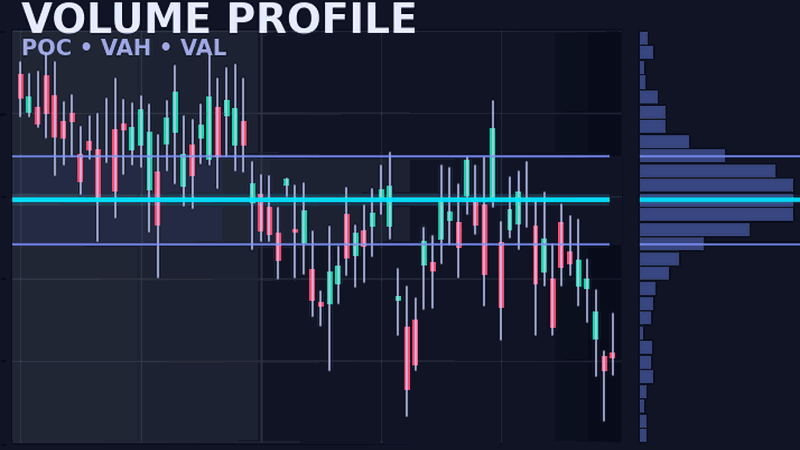
Combine with context. Order flow works best with market context. Use Volume Profile to identify key levels, then use order flow to see how participants behave at those levels. The combination is powerful.
For NinjaTrader setup instructions and indicator configuration, see our Order Flow Indicator Guide.
Summary: Order Flow Essentials
- Order flow shows buying vs selling activity at each price — what's behind the candle
- Delta = Ask volume − Bid volume (positive = buyers aggressive, negative = sellers aggressive)
- Cumulative delta tracks the running score — divergences from price signal weakening momentum
- Footprint charts reveal volume at each price level inside a candle
- Absorption (heavy volume, price holds) and exhaustion (heavy volume, price reverses) are key patterns
- Focus order flow analysis at key levels (PDH/L, VWAP, round numbers) for best signals