Why Real-Time Detection Matters
Most traders learn about liquidity sweeps after the fact. They see the long wick on their chart and think "that was a stop hunt" but by then the move is over. The real edge comes from recognizing sweeps as they happen, when you can still act on them.
Real-time sweep detection requires three skills: knowing where liquidity pools exist before price reaches them, recognizing the characteristics of a sweep while it unfolds, and having a systematic process for confirmation. This tutorial builds each skill step by step.
For comprehensive background on liquidity sweep concepts including buy-side/sell-side liquidity and Market Structure Shift (MSS), see our Liquidity Sweep Indicator Guide. This tutorial assumes familiarity with those concepts and focuses on practical real-time application.
What You Will Learn
- How to mark liquidity pools on your chart before price reaches them
- Real-time candle characteristics that signal a sweep is happening
- A systematic checklist for confirming sweep completion
- Common false sweep signals and how to avoid them
Step 1: Mapping Liquidity Pools
Before you can identify a sweep, you need to know where liquidity exists. This means marking potential stop-loss clusters on your chart before price reaches them. The goal is to have these levels identified so you are ready when price approaches.
Identify Swing Structure
Start by marking the obvious swing highs and swing lows on your timeframe. A swing high is a candle with lower highs on both sides. A swing low is a candle with higher lows on both sides. These swing points are where traders naturally place stops.
Focus on swing points that are clearly visible. If a swing high or low is obvious to you, it is obvious to thousands of other traders who have placed their stops just beyond it. The more obvious the level, the more liquidity is present.
Mark Equal Highs and Equal Lows
Equal highs (double tops) and equal lows (double bottoms) are premium liquidity zones. When price has rejected from the same level multiple times, traders gain confidence that the level will hold. They place stops just beyond it, creating a dense liquidity pool.
Draw horizontal lines at these equal levels and extend them forward. These are high-probability sweep targets. Institutions know exactly where these stops cluster and will often sweep them before reversing.
Consider Time-Based Liquidity
Liquidity also builds at session highs and lows. The overnight high, overnight low, previous day high, and previous day low are all significant liquidity zones. Traders reference these levels and place stops accordingly.
Mark these session levels on your chart each day. Pay particular attention when price approaches a session high or low during active market hours. These sweeps often occur during the first hour of the US session when volume increases.
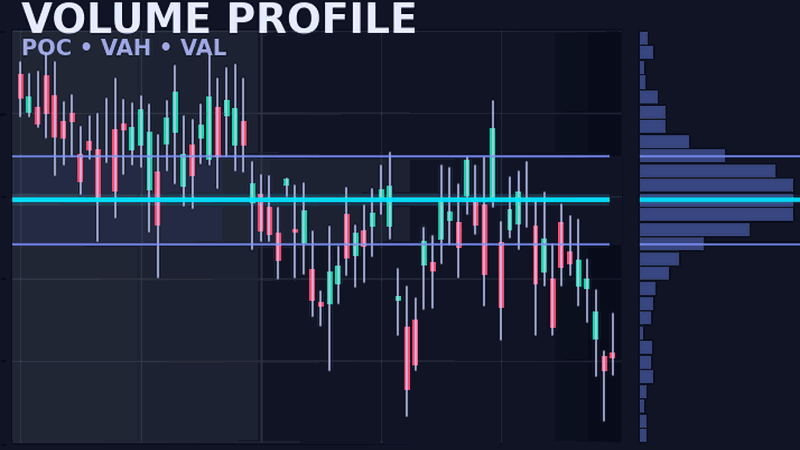
Pro Tip: Use Volume Profile
Combine liquidity mapping with Volume Profile analysis. Low Volume Nodes (LVNs) are areas where price moved quickly through thin order flow. Sweeps that target liquidity beyond an LVN tend to reverse sharply because there is little volume to absorb the move.
Step 2: Real-Time Sweep Recognition
With liquidity pools marked, the next step is recognizing when a sweep is actually happening. This requires watching price action closely as it approaches and penetrates your marked levels.
The Approach Phase
Before the sweep, watch how price approaches the liquidity level. Aggressive moves toward liquidity often indicate institutional intent. If price grinds slowly toward a level with small candles and low momentum, a sweep is less likely. If price accelerates toward the level with expanding candles, institutions may be driving price to trigger stops.
Pay attention to the time of day. Sweeps frequently occur during high-volume periods: the market open, the first hour of trading, and major news releases. A move toward liquidity during these times deserves extra attention.
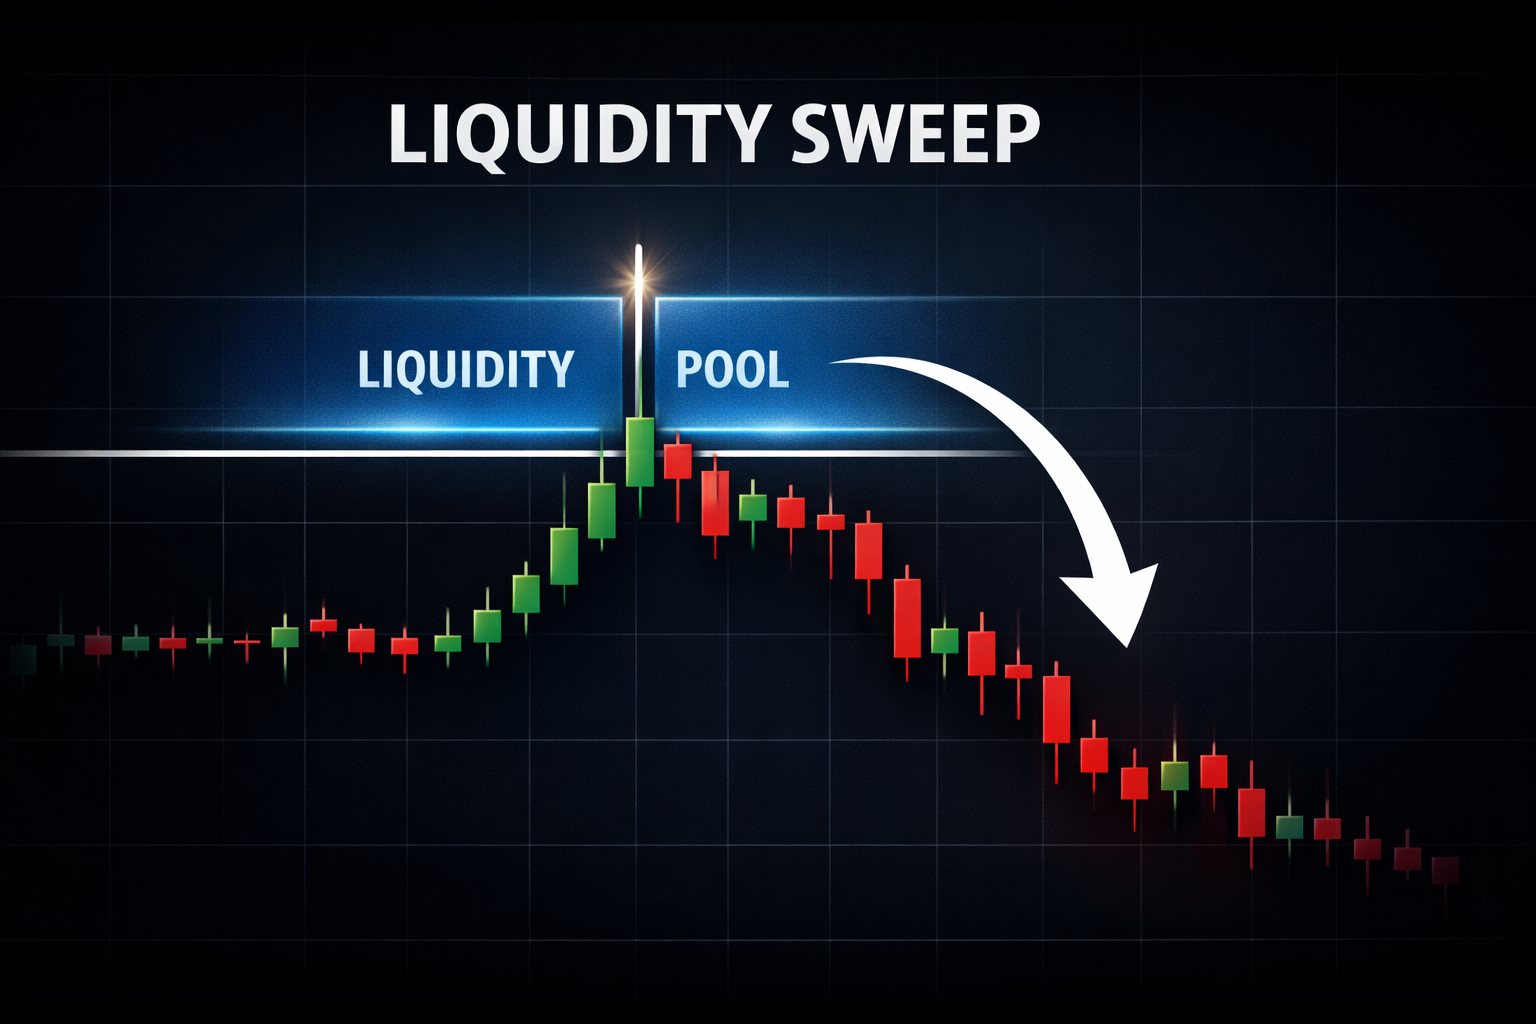
The Penetration Phase
The critical moment is when price breaks through your liquidity level. Watch the candle that penetrates the level closely. A true sweep will show specific characteristics in real-time:
- Quick penetration: Price moves through the level rapidly, not grinding slowly past it
- Immediate rejection: After taking the level, price immediately starts moving back
- Wick formation: The candle develops a long wick into the liquidity zone
- Body closes inside: The candle body closes back inside the previous range
Reading the Sweep Candle
The sweep candle itself tells a story. For a sell-side sweep (below support), look for a candle that wicks below the swing low but closes green or near its high. This shows that selling pressure pushed price down to trigger stops, but buyers absorbed all that supply and pushed price back up.
For a buy-side sweep (above resistance), look for a candle that wicks above the swing high but closes red or near its low. This shows that buying pressure pushed price up to trigger stops, but sellers absorbed that demand and pushed price back down.
The longer the wick relative to the body, the more aggressive the rejection. A candle with a wick three times the length of its body represents strong institutional absorption at that level.
Automated Sweep Detection
Get real-time alerts when liquidity sweeps occur. Auto-mark liquidity pools, track sweep candles, and receive MSS confirmation signals.
Step 3: Confirming the Sweep
Seeing a sweep candle is not enough. Many failed breakouts look like sweeps initially but price continues in the original direction. Confirmation separates high-probability setups from traps.
Wait for Candle Close
Never act on a sweep until the candle closes. A candle that looks like a sweep with five minutes left might fill in and close beyond the level by the time it completes. The close is your first confirmation that the sweep is real.
Once the sweep candle closes with a wick rejection and body back inside the range, you have initial confirmation. Now watch the next candle for follow-through in the reversal direction.
Market Structure Shift (MSS)
The strongest confirmation is a Market Structure Shift. After a sell-side sweep, bullish MSS occurs when price breaks above the most recent lower high. After a buy-side sweep, bearish MSS occurs when price breaks below the most recent higher low.
The MSS confirms that the sweep is complete and institutions are now positioning in the opposite direction. Without MSS, you are guessing that the sweep is over. With MSS, you have structural proof.
The Confirmation Checklist
Before Entering a Sweep Trade
- Liquidity level was marked in advance — you identified the pool before price reached it
- Sweep candle closed with rejection — wick into liquidity, body back inside range
- No immediate follow-through — next candle does not continue through the sweep level
- MSS confirmed — price breaks recent structure in the opposite direction
- Volume supports reversal — increased volume on the rejection candle (optional but helpful)
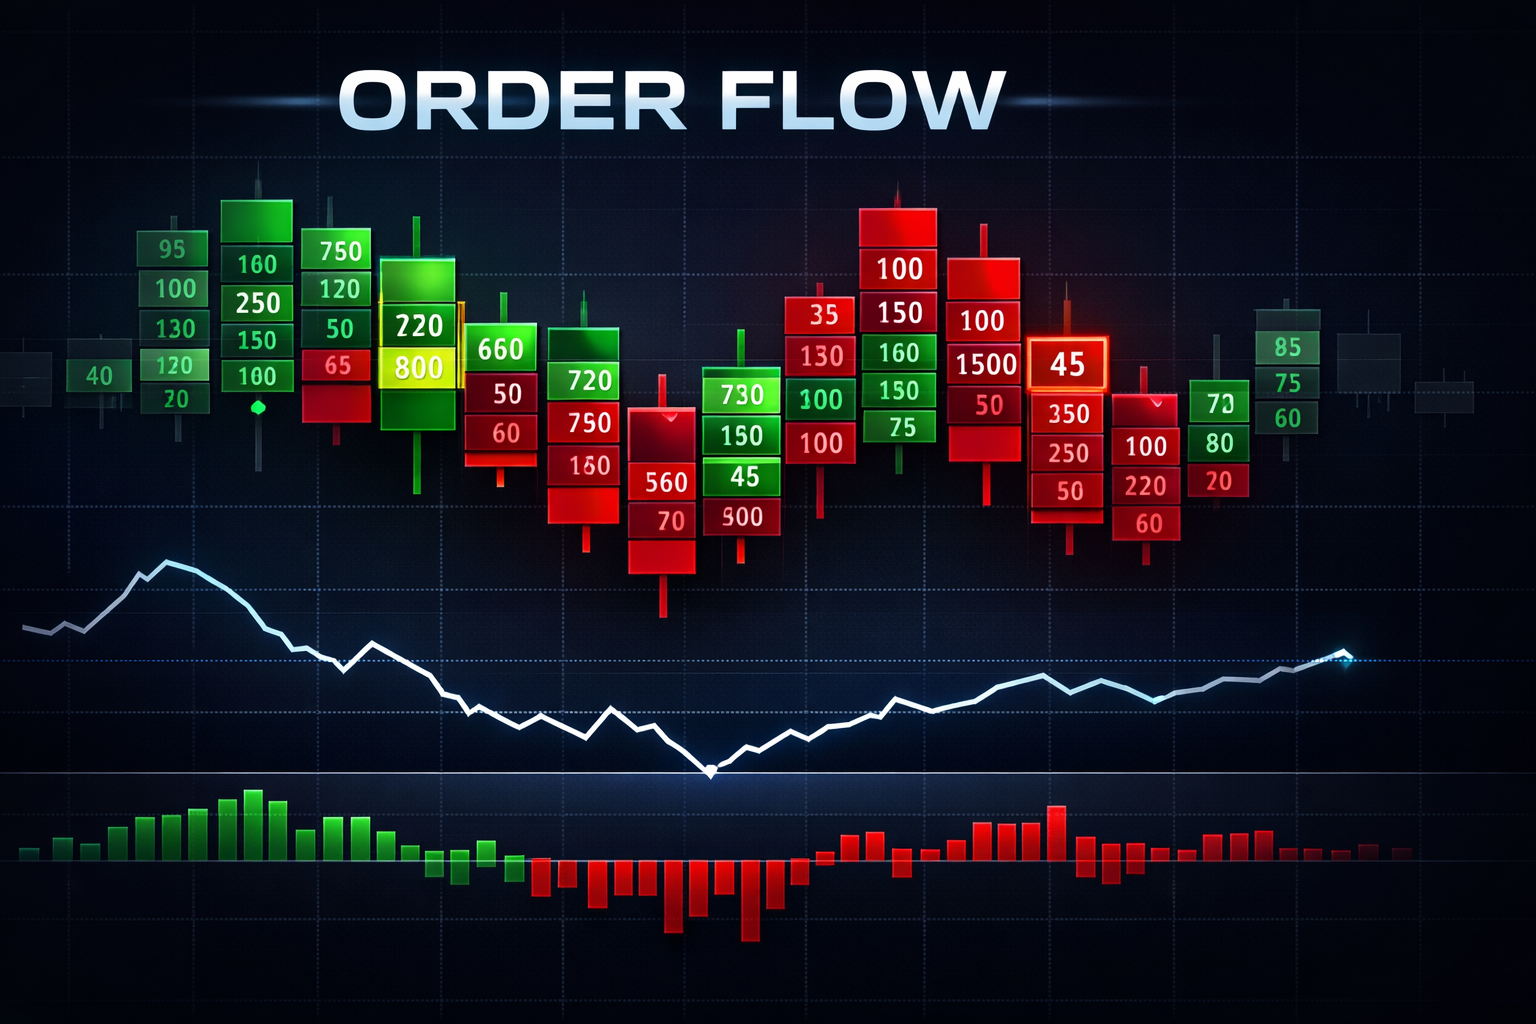
Step 4: Order Flow Confirmation
For traders using Order Flow Delta analysis, additional confirmation is available. Order flow shows what is happening inside the candles, revealing absorption patterns that confirm institutional activity.
Delta Divergence at Sweeps
During a legitimate sweep, you will often see delta divergence. For a sell-side sweep, price makes a new low but delta does not make a new low (or even turns positive). This shows that despite price going lower, buyers are absorbing the selling pressure.
For a buy-side sweep, price makes a new high but delta does not make a new high (or turns negative). This shows that despite price going higher, sellers are absorbing the buying pressure. This absorption is the footprint of institutional order filling.
Stacked Imbalances
On footprint charts, look for stacked imbalances at the sweep level. Buy imbalances stacking at a sell-side sweep show aggressive buyers absorbing supply. Sell imbalances stacking at a buy-side sweep show aggressive sellers absorbing demand.
These imbalances represent institutional order flow that retail traders cannot see on standard charts. When you see them align with your sweep analysis, you have strong confluence for a reversal.
Step 5: Avoiding False Sweeps
Not every penetration of a liquidity level is a sweep. Sometimes price breaks through and continues. Learning to distinguish true sweeps from failed ones protects your capital.
Signs of a False Sweep
- No wick rejection: The candle closes beyond the level with a small or no wick
- Follow-through candle: The next candle continues aggressively in the breakout direction
- Strong trend context: The move occurs during a strong established trend with momentum
- No MSS develops: Price fails to break recent structure in the reversal direction
- Order flow confirms direction: Delta continues in the breakout direction without absorption
Context Matters
Sweeps are more likely to succeed in ranging or consolidating markets where price is chopping between levels. During strong trends, what looks like a sweep may just be a brief pullback before continuation. Always consider the broader market context.
Higher timeframe trend direction also matters. A sweep of sell-side liquidity during an overall uptrend is more likely to produce a reversal than the same setup during a downtrend. Align your sweep trades with the higher timeframe bias when possible.
Common Mistake
Do not anticipate sweeps. Wait for price to actually take the liquidity level and show rejection. Entering before the sweep occurs means you are trading the same direction as the stops being hunted and will likely be stopped out yourself.
Practical Example: ES Futures Sweep
Here is a step-by-step walkthrough of identifying a liquidity sweep in real-time on ES (E-mini S&P 500 futures):
Scenario Setup
- Pre-market analysis: Mark overnight low at 5025.00 and previous day low at 5020.00 as sell-side liquidity targets
- Market opens: ES opens at 5045.00 and begins selling off toward overnight low
- Approach: Price accelerates into 5025.00 with expanding red candles
- Penetration: 9:42 AM candle wicks down to 5018.50, taking both overnight low and previous day low
- Rejection: Same candle closes at 5028.00 with a 9.5 point wick below the body
- Confirmation: Next candle is green, breaking above the 5032.00 swing high from the selloff
- MSS confirmed: Structure shift bullish — enter long at 5033.00
- Stop placement: Below sweep low at 5016.00
- Target: Back to session open at 5045.00, then overnight high
This example shows the complete process: pre-identified liquidity, real-time sweep recognition, candle close confirmation, and MSS entry trigger. The entry occurs after confirmation, not during the sweep itself.
Practice and Next Steps
Real-time sweep detection is a skill that improves with practice. Here is how to develop your ability to spot sweeps as they happen:
- Mark levels daily: Start each session by marking swing points, equal highs/lows, and session levels
- Watch price approach: When price nears your levels, focus your attention and watch closely
- Journal every sweep: Record sweeps you see, whether you traded them or not, and review weekly
- Use replay: Practice on NinjaTrader Market Replay to see sweeps unfold at accelerated speed
Related Resources
- Liquidity Sweep Indicator Guide — comprehensive theory and NinjaScript implementation
- Order Flow Delta Guide — learn to confirm sweeps with delta analysis
- Volume Profile Guide — identify HVN/LVN levels for sweep targets
Professional Sweep Detection
Auto-mark liquidity pools, get real-time sweep alerts, and see MSS confirmation signals with institutional-grade precision.