What Delta & Cumulative Delta Actually Measure
Before we talk about divergences, you need to understand what delta is actually counting. This isn't complicated, but people get it wrong all the time—so let's be precise.
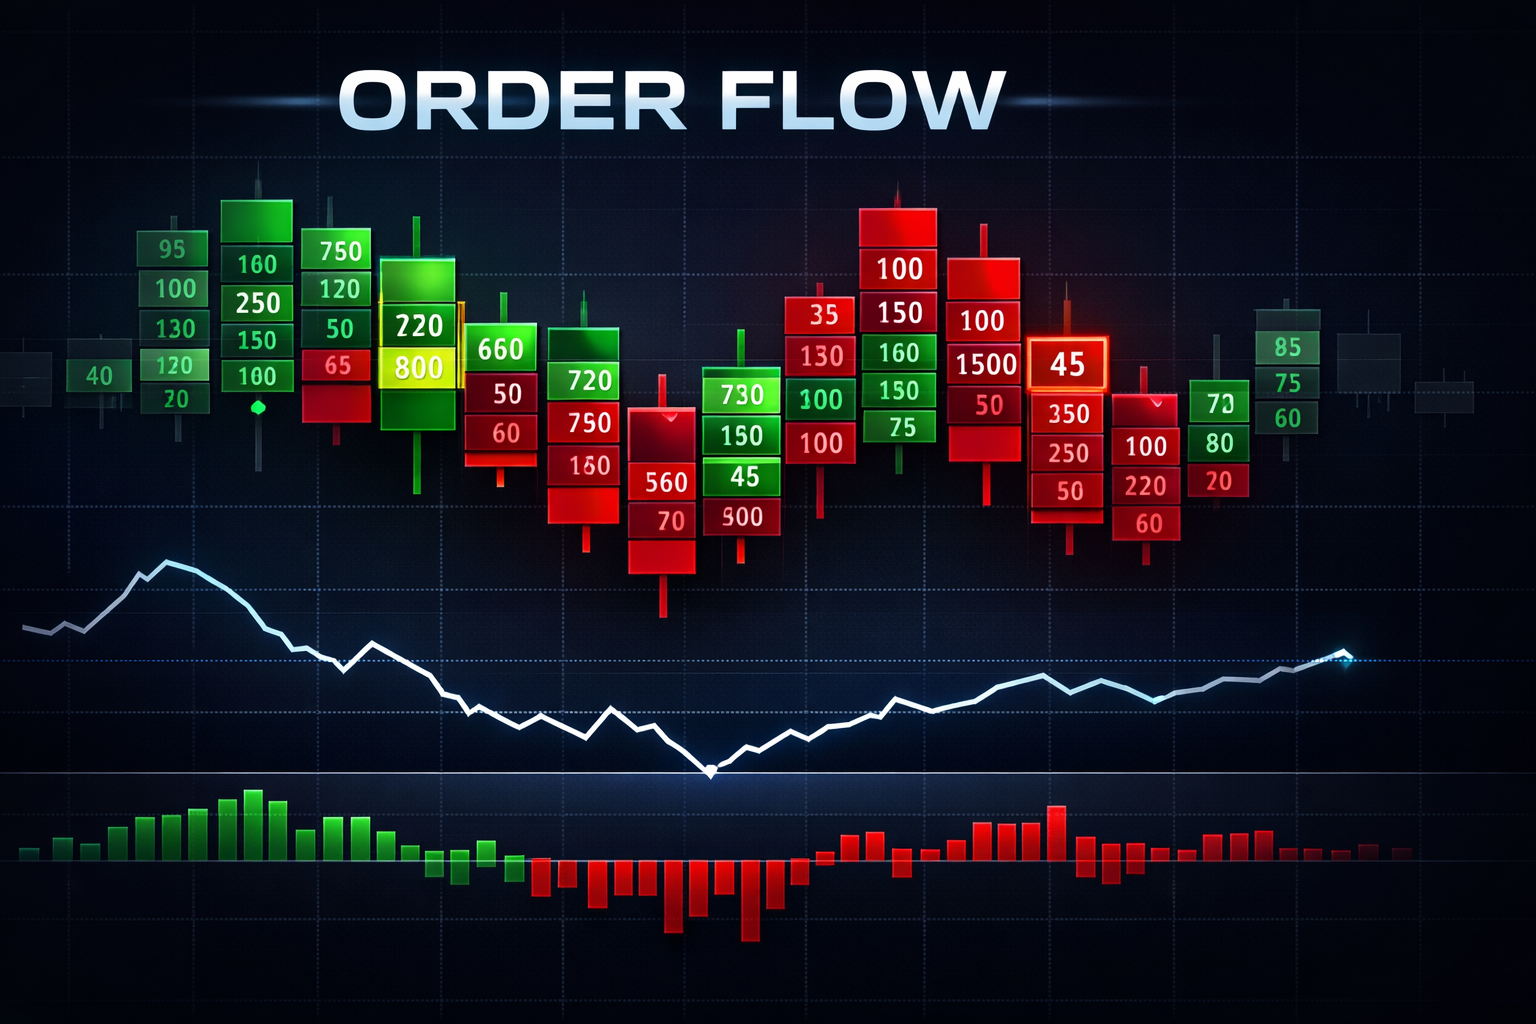
Delta is the difference between volume traded at the ask price and volume traded at the bid price during a given period (one bar, one candle, whatever your timeframe is).
- Buying at the ask (hitting the offer): A market buy order lifts the ask. This is counted as aggressive buying. It takes urgency to pay the higher price.
- Selling at the bid (hitting the bid): A market sell order hits the bid. This is counted as aggressive selling. The seller wanted out badly enough to accept the lower price.
Delta = Ask Volume − Bid Volume. Positive delta means more aggressive buyers. Negative delta means more aggressive sellers. Simple.
Delta ≠ Total Buying or Selling
Delta only measures aggressive participation—market orders that cross the spread. It ignores limit orders sitting passively on the book. A large institution absorbing selling with hidden limit bids won't show up in delta until the price effect becomes visible. Delta tells you who's urgent, not who's in control.
Cumulative delta adds up every bar's delta from the session open (or another anchor point). It creates a running total of net aggressive buying vs. selling across the entire session.
Think of it this way: individual bar delta is a snapshot. Cumulative delta is the story of the whole day. If cumulative delta is rising, aggressive buyers have been dominant overall. If it's falling, sellers have been pressing harder.
The reason this matters: price can move for many reasons—passive absorption, short covering, thin liquidity. But cumulative delta shows you the trend of aggression. When price and aggression agree, the move is genuine. When they disagree? That's where delta divergence comes in.
If you're new to order flow concepts, our Order Flow for Beginners guide covers the foundations in more detail.
How Delta Divergences Form
A delta divergence happens when price and cumulative delta are telling different stories. One is going up while the other is going down. That disagreement is the signal.
Bearish Delta Divergence
Price makes a new high (or a higher high). Meanwhile, cumulative delta makes a lower high or is declining. Translation: price is climbing, but aggressive buyers are not as strong as before. The move is being sustained by something other than new buying pressure—maybe short covering, maybe passive absorption running out, maybe just thin liquidity getting pushed around.
This is the classic "the crowd is chasing, but the smart money has stopped buying" setup. It doesn't mean price drops immediately. But it means the fuel for the rally is running low.
Bullish Delta Divergence
The mirror image. Price makes a new low (or lower low). Cumulative delta makes a higher low or is actually rising. Aggressive sellers are exhausting themselves. Someone is absorbing the selling with limit buy orders, and the pressure to push lower is fading.
This often appears at the end of morning sell-offs on NQ. Price keeps grinding lower, retail traders are panicking out, but cumulative delta is quietly flattening or ticking up. The sellers are done—they just don't know it yet.
Why Divergences Work (When They Do)
Markets move when aggressive participants push price. When aggression diverges from price, it means the current move is running on fumes. Passive participants (limit orders) are absorbing the aggression. Eventually, the aggressive side exhausts itself, and price reverses toward where the real absorption happened. That's the theory. In practice, "eventually" can take longer than your account can handle.
Types of Delta Divergence
Not all divergences are created equal. Here are the main types and what they're actually telling you.
Regular Bearish Divergence
Price: higher high. Cumulative delta: lower high. This is the most commonly discussed type. It suggests the uptrend is weakening. Aggressive buyers are losing steam relative to the last price peak. Often seen at session highs, prior day highs, and near significant resistance levels.
Regular Bullish Divergence
Price: lower low. Cumulative delta: higher low. The downtrend is losing conviction. Sellers are getting absorbed. Frequently appears at VWAP tests, prior day lows, and session support. If you're unfamiliar with VWAP dynamics, our VWAP guide covers how institutional benchmarking creates support levels.
Hidden Bearish Divergence
Price: lower high (already in a downtrend). Cumulative delta: higher high. Wait—buyers are actually pushing harder, but price can't make a new high? That's heavy passive selling overhead. Institutions are distributing into the buying pressure. Price is being capped despite aggressive demand. This is a trend continuation signal—the downtrend is likely to resume.
Hidden Bullish Divergence
Price: higher low (already in an uptrend). Cumulative delta: lower low. Sellers threw everything they had at it, but price barely dipped. Someone is aggressively absorbing sell orders with passive bids. The uptrend is likely to continue.
Regular vs. Hidden: Quick Reference
- Regular divergence = potential reversal signal. Price is extended, and aggression is fading.
- Hidden divergence = potential continuation signal. The trend is absorbing counter-trend aggression.
Hidden divergence is harder to spot and less widely known, but it's arguably more reliable because it trades with the existing trend rather than trying to pick a top or bottom.
NQ-Specific Patterns: Why Delta Reads Differently on Nasdaq Futures
NQ isn't ES. It doesn't behave the same way, and delta divergence readings need to be interpreted through the lens of what NQ actually is.
The Mega-Cap Problem
The Nasdaq 100 is absurdly concentrated. The top 7-8 stocks (Apple, Microsoft, Nvidia, Amazon, Meta, Alphabet, Tesla, Broadcom) can represent 50%+ of the index weight. When NVDA rips 4% on an AI headline, NQ can rally 150+ points even if 70 of the other 93 components are flat or down.
What does this mean for delta? The NQ futures delta is a single aggregate number. It doesn't distinguish between buying driven by broad participation (most stocks moving up together) and buying driven by a mega-cap rotation (institutions piling into 3-4 names).
Here's where it gets tricky: a mega-cap-driven rally can show strong positive delta because there is genuinely heavy buying in NQ futures. But if the underlying breadth is weak, the move is fragile. Delta alone won't tell you this. You need market internals (like Nasdaq advance/decline or TICK-NQ) to distinguish between these scenarios.
NQ's Higher Volatility and Delta Spikes
NQ is more volatile than ES. Its average daily range is wider relative to its price. This means delta can spike dramatically on individual bars, especially around the open and during major economic releases. A single 1-minute bar on NQ can print delta of ±5,000+ contracts.
These spikes can create false divergence signals. Price makes a new low on a bar with -6,000 delta, then makes a slightly lower low on a bar with -2,000 delta. Technically, that's bullish delta divergence. But it might just be the difference between hitting a stop cluster (spike) and normal market flow (smaller delta). Context matters more than pattern matching.
Overnight vs. RTH Delta
NQ trades nearly 24 hours. If your cumulative delta resets at the ETH open (6pm ET Sunday), you're including hours of thin overnight trading in your calculation. Overnight delta is noisy—low volume, wide spreads, and algorithmic activity can dominate.
Many NQ traders reset cumulative delta at the RTH open (9:30 ET) for a cleaner signal. Others use the first 30 minutes of RTH as a "warm-up" and only look for divergence signals after 10:00 ET when the market has established a range. There's no universally correct answer—test both approaches on your own data.
Ready for Professional Order Flow Tools?
Get advanced delta, cumulative delta, and order flow indicators with automated divergence detection for NinjaTrader 8.
Practical Setups: Entry & Exit Rules
Theory is useless without execution. Here are concrete setups you can actually trade. But first—a disclaimer that should be obvious but apparently isn't: no setup works all the time. These are probabilities, not guarantees. Test everything yourself.
Setup 1: Bearish Delta Divergence at Prior Day High
- Context: NQ is rallying and approaching or testing yesterday's high. Time is between 9:45-11:30 ET (morning session when volume is thick enough for reliable delta).
- Signal: Price touches or exceeds the prior day high. Cumulative delta is below its level from the last price swing high. Per-bar delta on the push to the highs is declining—each new high prints with less aggressive buying than the one before.
- Entry: Short on the first bar that closes below the prior day high after the divergence prints. Or wait for a break below the 5-minute swing low for confirmation.
- Stop: Above the highest price printed during the divergence, plus 4-6 NQ points of buffer.
- Target: VWAP (conservative) or the developing VPOC (moderate). Scale out at the first target, trail the remainder.
Setup 2: Bullish Delta Divergence at VWAP
- Context: NQ has been trending up from the open. It pulls back to VWAP during mid-morning rotation. VWAP is still rising (confirming uptrend).
- Signal: Price tests VWAP and prints a slightly lower low than the first touch. But cumulative delta holds above its level from that first touch—sellers tried harder on the second push but got absorbed. Per-bar delta on the second low is less negative than the first.
- Entry: Long on the first bar that closes back above VWAP. Or on a micro-higher-high on a 1-minute chart above the swing low structure.
- Stop: Below the lowest price of the divergence, minus 4-6 NQ points.
- Target: The prior swing high (first target), then the session high or +1σ VWAP deviation band.
Setup 3: Hidden Bullish Divergence in an Uptrend
- Context: NQ has been trending higher all morning. A pullback occurs but price holds a higher low relative to the prior swing low.
- Signal: During the pullback, cumulative delta actually drops below the prior swing low's cumulative delta level. Sellers were more aggressive this time—but price didn't break down. Passive buyers absorbed everything.
- Entry: Long when price starts making higher lows on a short timeframe (1-2 minute bars showing a shift back up).
- Stop: Below the swing low that formed the higher low.
- Target: New session highs. This is a trend continuation trade—if the trend is real, there's room to run.
Where to Look for Divergences
Delta divergences at random price points are just noise. Look for them at levels that matter:
- • VWAP — session equilibrium
- • Prior day high/low — significant reference levels
- • Session open price — gap fill or gap-and-go inflection
- • VPOC / Value Area edges — Volume Profile levels where volume clustered
- • Round numbers — psychological levels (22,000, 22,500)
A delta divergence at a key level is a signal. A delta divergence in the middle of nowhere is probably just market noise.
Common Mistakes That Will Cost You Money
I've seen traders lose serious money by misusing delta divergence. Here are the most common errors.
Mistake 1: Using Delta in Isolation
Delta divergence is a supporting tool, not a standalone system. "Cumulative delta is diverging, therefore short" is how you blow up. Delta tells you about aggression—it doesn't tell you about passive absorption, overall context, or the macro picture.
Always ask: does the broader context support this divergence? Is the market at a significant level? Do market internals confirm? Is there a catalyst that explains why the divergence might not matter?
Mistake 2: Ignoring Time of Day
Delta divergence between 9:30-10:00 ET is unreliable. The open is chaotic—market orders flying everywhere, stops getting triggered, gap fills happening. Cumulative delta is being yanked around by opening volatility, not by meaningful directional conviction.
Similarly, delta divergence between 12:00-1:00 ET (lunch) often means nothing. Volume drops by 50%+, and a few hundred aggressive contracts can swing cumulative delta significantly. The divergence isn't "real"—it's just low-volume noise.
The sweet spots: 10:00-11:30 ET and 2:00-3:30 ET. Volume is steady, institutional flow is present, and divergences are more likely to be meaningful.
Mistake 3: Only Watching Cumulative Delta
Cumulative delta is the big picture. But you also need per-bar delta for context. A cumulative delta divergence can persist for 30+ minutes while price keeps grinding in the same direction. That's a great way to take a loss and then watch the divergence "resolve" by cumulative delta catching up to price rather than price reversing.
Check per-bar delta for timing. When individual bars start showing delta shifting (green bars printing on down candles, or negative delta on up candles), the divergence is getting closer to mattering. Cumulative delta shows you the setup; per-bar delta gives you the trigger.
Mistake 4: Trading Every Divergence
Not every divergence leads to a reversal. Some are just temporary pauses before the trend continues. If you trade every single divergence signal, you'll get chopped up. Be selective. Wait for divergences at key levels with additional confirmation. Three mediocre trades a day cost more than one high-conviction trade.
Mistake 5: Ignoring the Spread Impact
Delta classification depends on whether a trade executes at the bid or ask. During fast markets, the spread can widen, and trade classification becomes less reliable. Trades executing inside the spread get assigned algorithmically—and different platforms may classify them differently. NinjaTrader, Sierra Chart, and Bookmap can all show slightly different delta readings from the same data feed. Keep this in mind when you see a "perfect" divergence signal.
Automating Delta Divergence Detection in NinjaTrader 8
Manually watching cumulative delta and comparing swing points is tedious and error-prone. NinjaTrader 8 gives you tools to automate this—both built-in and through custom scripts.
Built-in Order Flow Tools
NinjaTrader 8 includes Order Flow + features (available with a funded account or Lifetime license):
- Order Flow Cumulative Delta: Displays cumulative delta as a bar chart or line below your price chart. This is your starting point. Set it to reset at the session start (RTH or ETH depending on your preference).
- Order Flow VWAP: Combine this with the delta indicator to overlay divergence analysis at VWAP levels.
- Volumetric Bars: Show per-bar ask vs. bid volume directly on the candle bodies. This gives you the per-bar delta context you need for timing entries.
The built-in tools are solid for visualizing delta. But they don't automatically detect divergences. For that, you need custom scripting.
Custom NinjaScript Indicators
NinjaTrader's NinjaScript (C#) lets you build custom indicators that automatically identify delta divergence. Here's the general logic:
- Step 1: Calculate per-bar delta (ask volume – bid volume) using
GetCurrentAskVolume()andGetCurrentBidVolume()methods or by processing tick data. - Step 2: Maintain a running cumulative delta series as a custom data series.
- Step 3: Implement a swing detection algorithm on both price and cumulative delta (identify swing highs and swing lows on each).
- Step 4: Compare: when price swing high > previous price swing high AND cumulative delta swing high < previous cumulative delta swing high → bearish divergence alert. Mirror for bullish.
- Step 5: Add filters: only trigger at specific levels (near VWAP, near prior day H/L), only during certain time windows, only when minimum volume thresholds are met.
If you're not comfortable writing NinjaScript from scratch, third-party indicators exist that package this logic. Some are worth the money; many are overpriced for what they do. Test any indicator on replay data before putting real capital behind it. Our Order Flow indicators page covers several options.
Automation Caveat
Automated divergence detection will generate more signals than you should trade. The indicator sees the pattern. It doesn't see the context. Use automation to alert you to potential setups—then apply your own judgment about whether the context supports the trade. Full automation of delta divergence strategies is extremely difficult to make profitable.
When Delta Divergence Fails (And It Will)
Let's be honest. Delta divergence is not magic. It fails regularly, and understanding when it fails is more valuable than knowing when it works.
Choppy, Range-Bound Markets
When NQ is chopping in a 30-point range with no directional conviction, cumulative delta oscillates randomly. You'll see "divergences" everywhere because both price and delta are just noise. Every local high and low will have some divergence if you squint hard enough. The signal-to-noise ratio drops to near zero.
Fix: Don't look for delta divergence during chop. If the market has no range expansion and volume is declining, sit on your hands. Divergence is a tool for trending or semi-trending markets.
Low Volume Sessions
Half-days, pre-holiday sessions, summer Fridays. Volume on NQ can drop 40-60% below normal. When volume is thin, individual large orders can swing delta dramatically. A single 200-lot market order can make cumulative delta jump in a way that creates a "divergence" that means absolutely nothing.
Fix: Track average volume. If today's volume is significantly below the 20-day average, reduce your confidence in any delta-based signal.
News Events and Catalysts
FOMC announcements, CPI releases, major earnings (especially NVDA or AAPL for NQ)—these blow up all order flow analysis. In the seconds around a news release, delta can spike thousands of contracts in one direction, then reverse completely. The market is repricing based on new information, not on technical levels.
Fix: Don't trade delta divergence within 15-30 minutes of a major economic release. Let the market digest the news, establish a new range, and then resume normal analysis.
Persistent Trend Days
On strong trend days—the 2-3 standard deviation move days—delta divergence can form early and persist for hours while price keeps trending. The divergence is technically there. But the market doesn't care. Momentum overwhelms the divergence.
This is how traders who over-rely on delta divergence get destroyed. They see the divergence at 10am, short, take a loss, see another divergence at 11am, short again, lose more. The divergence is real but the trend is stronger.
Fix: If a divergence-based trade gets stopped out and price makes new extremes without resolving the divergence, the trend is too strong. Don't re-enter the same direction. Respect the trend.
The Honest Truth
If someone tells you delta divergence works 80%+ of the time, they're either lying, curve-fitting, or selling you something. In my experience, high-quality delta divergence setups (at key levels, with confirmation, during appropriate times) work maybe 55-65% of the time. That's enough to be profitable with proper risk management—but it's not a crystal ball. Treat it as an edge, not a guarantee.
Combining Delta Divergence with Other Tools
Delta divergence is most powerful when combined with other forms of analysis. Here's what to stack with it.
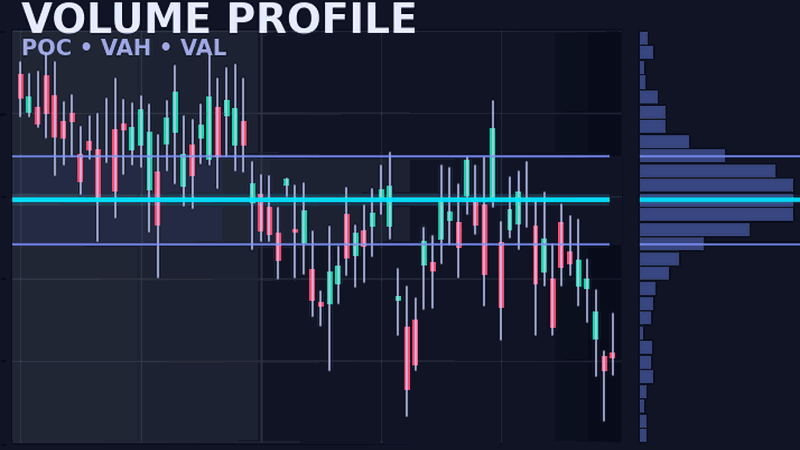
Volume Profile
Volume Profile shows you where the most trading occurred. Delta divergence shows you the quality of buying/selling at those prices. Together, they're powerful.
Example: NQ approaches a high-volume node (HVN) from below. Price tests it and makes a slightly higher high. But cumulative delta is declining. You've got a key Volume Profile level and a delta divergence—that's confluence. The HVN tells you "this price is important." The divergence tells you "buyers can't break through." The trade idea practically writes itself.
VPOC levels are particularly effective when combined with delta divergence at session extremes.
VWAP
VWAP gives you the session's fair value. Delta divergence at VWAP is one of the highest-probability setups you can find on NQ. Why? Because VWAP is where institutions are benchmarked. A delta divergence at VWAP means aggressive traders are failing to push price away from fair value—institutional passive orders are absorbing them.
VWAP deviation bands add another layer. A bearish delta divergence at the +2σ VWAP band combines statistical extension with weakening buying pressure. Mean reversion back to VWAP becomes very high probability.
Market Internals
This is the missing piece most traders ignore. NQ delta tells you about aggression in the NQ futures contract. Market internals (TICK, ADD, VOLD) tell you about the broader Nasdaq market.
The best delta divergence trades happen when internals confirm. Price makes a new high on NQ, cumulative delta is lower, and the TICK is making lower highs, and the advance-decline line is flat or declining. That's three independent signals saying the same thing: this rally is hollow.
Conversely, if delta diverges but internals are screaming bullish (TICK at +800, advancing issues expanding), the divergence is probably noise—maybe a temporary pause, not a reversal.
Footprint Charts
Footprint charts show you the bid/ask volume at every price within every bar. They're the granular version of delta. While cumulative delta gives you the macro view, footprint charts let you zoom into the specific bars where the divergence is forming and see exactly where absorption is happening.
Look for: large bid volume at price lows (during a bearish delta divergence at resistance), or large ask volume at price highs (during a bullish delta divergence at support). That's the passive absorption in action.
The Confluence Checklist
- ✓ Delta divergence present (regular or hidden)
- ✓ At a key level (VWAP, Volume Profile node, prior day H/L, round number)
- ✓ During active trading hours (10:00-11:30 or 2:00-3:30 ET)
- ✓ Market internals confirming (TICK, ADD direction)
- ✓ Per-bar delta showing shift in aggression
- ✓ Volume adequate (not a low-volume session)
You don't need all six. But 4-5 out of 6 makes a high-conviction trade. 2 out of 6 means you're gambling.
Summary: Delta Divergence Essentials for NQ
- Delta measures aggressive buying (ask volume) minus aggressive selling (bid volume) — it's about urgency, not total volume
- Regular divergence (price vs. cumulative delta disagreeing) signals potential reversals; hidden divergence signals trend continuation
- NQ-specific: mega-cap concentration means delta can look strong even when breadth is weak — always check internals
- Location matters: divergences at key levels (VWAP, VPOC, prior day H/L) are signals; divergences at random prices are noise
- It fails regularly — in chop, low volume, news events, and strong trend days. Expect 55-65% accuracy with proper filters, not 80%+
- Never use alone — combine with Volume Profile, VWAP, market internals, and per-bar analysis for confluence